The following section is a summary with a number of examples that illustrates the usage of the methods described in the previous sections.
Objectives:
-
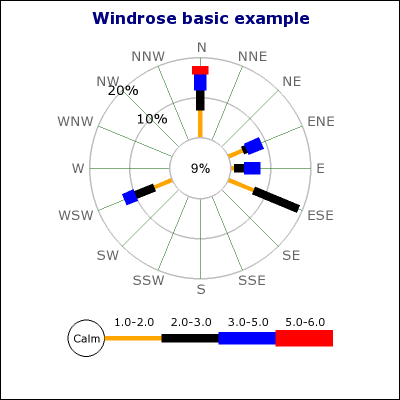
Showing a complete but elementary windrose plot using mostly default values.
-
Adding and formatting a title
-
Adding a legend text in order to show the units.
-
Showing how to specify data using both ordinal and textual representation of compass directions.
Example 21.7. (windrose_ex1.php)
1 2 3 4 5 6 7 8 9 10 11 12 13 14 15 16 17 18 19 20 21 22 23 24 25 26 27 | require_once ('jpgraph/jpgraph.php'); require_once ('jpgraph/jpgraph_windrose.php'); $data = array( 0 => array(1,1,2.5,4), 1 => array(3,4,1,4), 'wsw' => array(1,5,5,3), 'N' => array(2,7,5,4,2), 15 => array(2,7,12)); // First create a new windrose graph with a title $graph = new WindroseGraph(400,400); // Setup title $graph->title->Set('Windrose basic example'); $graph->title->SetFont(FF_VERDANA,FS_BOLD,12); $graph->title->SetColor('navy'); // Create the windrose plot. $wp = new WindrosePlot($data); $wp->SetRadialGridStyle('solid'); $graph->Add($wp); // Send the graph to the browser $graph->Stroke(); |
Objectives:
-
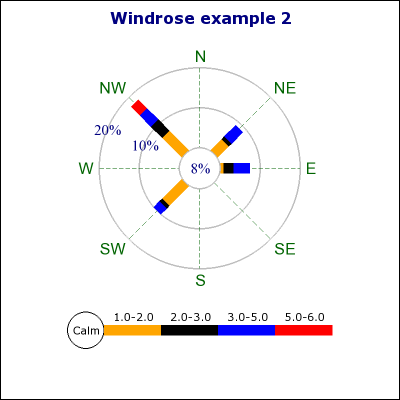
Showing how to customize the width of the windrose legs
-
Showing how to only display 8 compass axis
-
Showing how to set a specific size in pixels for the plot
-
Showing how to adjust the size of the center circle
-
Showing how to adjust scale label font &colors
-
Showing how to adjust the font for the compass directions
Example 21.8. (windrose_ex2.php)
1 2 3 4 5 6 7 8 9 10 11 12 13 14 15 16 17 18 19 20 21 22 23 24 25 26 27 28 29 30 31 32 33 34 35 36 37 38 39 40 41 42 43 44 45 46 47 48 | require_once ('jpgraph/jpgraph.php'); require_once ('jpgraph/jpgraph_windrose.php'); // Data can be specified using both ordinal index of the axis // as well as the direction label $data = array( 0 => array(1,1,2.5,4), 1 => array(3,4,1,4), 3 => array(2,7,4,4,3), 5 => array(2,7,1,2)); // First create a new windrose graph with a title $graph = new WindroseGraph(400,400); // Setup title $graph->title->Set('Windrose example 2'); $graph->title->SetFont(FF_VERDANA,FS_BOLD,12); $graph->title->SetColor('navy'); // Create the windrose plot. $wp = new WindrosePlot($data); // Make it have 8 compass direction $wp->SetType(WINDROSE_TYPE8); // Setup the weight of the laegs for the different ranges $weights = array_fill(0,8,10); $wp->SetRangeWeights($weights); // Adjust the font and font color for scale labels $wp->scale->SetFont(FF_TIMES,FS_NORMAL,11); $wp->scale->SetFontColor('navy'); // Set the diametr for the plot to 160 pixels $wp->SetSize(200); // Set the size of the innermost center circle to 30% of the plot size $wp->SetZCircleSize(0.2); // Adjust the font and font color for compass directions $wp->SetFont(FF_ARIAL,FS_NORMAL,12); $wp->SetFontColor('darkgreen'); // Add and send back the graph to the client $graph->Add($wp); $graph->Stroke(); |
Objectives:
-
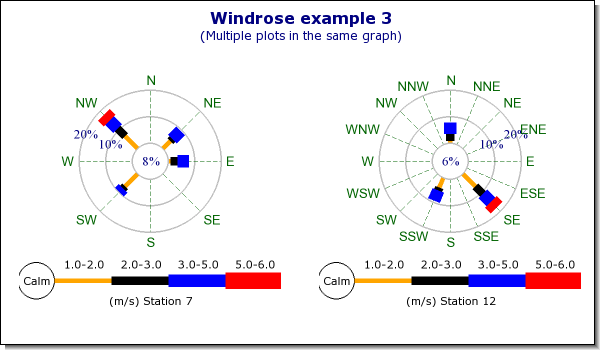
Showing how to add multiple plots to the same graph
-
Showing how to add a subtitle and a drop shadow to the graph
-
Showing how to change size and position for plots
-
Showing how to add legend text
Example 21.9. (windrose_ex3.php)
1 2 3 4 5 6 7 8 9 10 11 12 13 14 15 16 17 18 19 20 21 22 23 24 25 26 27 28 29 30 31 32 33 34 35 36 37 38 39 40 41 42 43 44 45 46 47 48 49 50 51 52 53 54 55 56 57 58 59 60 61 62 63 64 65 66 67 68 69 70 71 72 | require_once ('jpgraph/jpgraph.php'); require_once ('jpgraph/jpgraph_windrose.php'); // Data can be specified using both ordinal index of the axis // as well as the direction label $data[0] = array( 0 => array(1,1,2.5,4), 1 => array(3,4,1,4), 3 => array(2,7,4,4,3), 5 => array(2,7,1,2)); $data[1] = array( "n" => array(1,1,2.5,4), "ssw" => array(3,4,1,4), "se" => array(2,7,4,4,3)); // Store the position and size data for each plot in an // array to make it easier to create multiple plots. // The format choosen for the layout data is // (type,x-pos,y-pos,size, z-circle size) $layout = array( array(WINDROSE_TYPE8,0.25,0.55,0.4,0.25), array(WINDROSE_TYPE16,0.75,0.55,0.4,0.25)); $legendtxt = array('(m/s) Station 7','(m/s) Station 12'); // First create a new windrose graph with a dropshadow $graph = new WindroseGraph(600,350); $graph->SetShadow('darkgray'); // Setup titles $graph->title->Set('Windrose example 3'); $graph->title->SetFont(FF_VERDANA,FS_BOLD,12); $graph->title->SetColor('navy'); $graph->subtitle->Set('(Multiple plots in the same graph)'); $graph->subtitle->SetFont(FF_VERDANA,FS_NORMAL,9); $graph->subtitle->SetColor('navy'); // Create the two windrose plots. for( $i=0; $i < count($data); ++$i ) { $wp[$i] = new WindrosePlot($data[$i]); // Make it have 8 compass direction $wp[$i]->SetType($layout[$i][0]); // Adjust the font and font color for scale labels $wp[$i]->scale->SetFont(FF_TIMES,FS_NORMAL,10); $wp[$i]->scale->SetFontColor('navy'); // Set the position of the plot $wp[$i]->SetPos($layout[$i][1],$layout[$i][2]); // Set the diameter for the plot to 30% of the width of the graph pixels $wp[$i]->SetSize($layout[$i][3]); // Set the size of the innermost center circle to 30% of the plot size $wp[$i]->SetZCircleSize($layout[$i][4]); // Adjust the font and font color for compass directions $wp[$i]->SetFont(FF_ARIAL,FS_NORMAL,10); $wp[$i]->SetFontColor('darkgreen'); // Add legend text $wp[$i]->legend->SetText($legendtxt[$i]); $graph->Add($wp[$i]); } // Send the graph to the browser $graph->Stroke(); |
Objectives:
-
Showing how to add arbitrary paragraphs of text to a graph
-
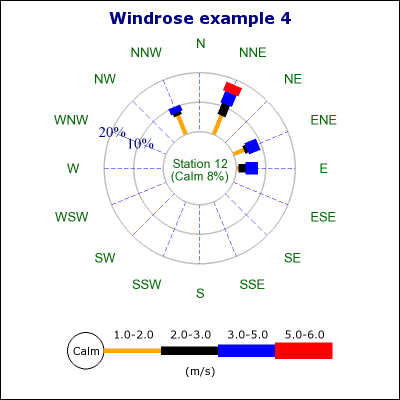
Showing how to manually set the grid distance
-
Showing how to adjust the grid colors
-
Showing how to customize the format for the displayed ranges
-
Showing how to add arbitrary text to the center circle
-
Showing how to adjust the margin for the legend
-
Showing how to increase the margin to the compass directions
Example 21.10. (windrose_ex4.php)
1 2 3 4 5 6 7 8 9 10 11 12 13 14 15 16 17 18 19 20 21 22 23 24 25 26 27 28 29 30 31 32 33 34 35 36 37 38 39 40 41 42 43 44 45 46 47 48 49 50 51 52 53 54 55 56 57 | require_once ('jpgraph/jpgraph.php'); require_once ('jpgraph/jpgraph_windrose.php'); // Data can be specified using both ordinal index of the axis // as well as the direction label $data = array( 0 => array(1,1,2.5,4), 1 => array(3,4,1,4), 3 => array(2,7,4,4,3), 5 => array(2,7,1,2)); // First create a new windrose graph with a title $graph = new WindroseGraph(400,400); // Setup title $graph->title->Set('Windrose example 4'); $graph->title->SetFont(FF_VERDANA,FS_BOLD,12); $graph->title->SetColor('navy'); // Create the windrose plot. $wp = new WindrosePlot($data); // Adjust the font and font color for scale labels $wp->scale->SetFont(FF_TIMES,FS_NORMAL,11); $wp->scale->SetFontColor('navy'); // Set the diameter and position for plot $wp->SetSize(190); // Set the size of the innermost center circle to 40% of the plot size // Note that we can have the automatic "Zero" sum appear in our custom text $wp->SetZCircleSize(0.38); $wp->scale->SetZeroLabel("Station 12\n(Calm %d%%)"); // Adjust color and font for center circle text $wp->scale->SetZFont(FF_ARIAL,FS_NORMAL,9); $wp->scale->SetZFontColor('darkgreen'); // Adjust the font and font color for compass directions $wp->SetFont(FF_ARIAL,FS_NORMAL,10); $wp->SetFontColor('darkgreen'); // Adjust the margin to the compass directions $wp->SetLabelMargin(50); // Adjust grid colors $wp->SetGridColor('silver','blue'); // Add (m/s) text to legend $wp->legend->SetText('(m/s)'); $wp->legend->SetMargin(20,5); // Add and send back to client $graph->Add($wp); $graph->Stroke(); |
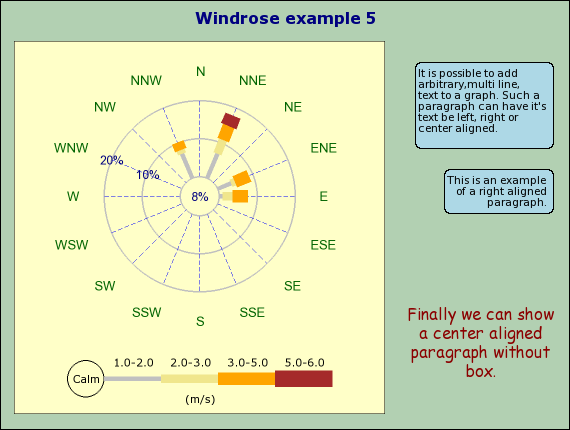
Objectives:
-
Showing how to add arbitrary paragraphs of text to a graph
-
Showing how to manually set the grid distance
-
Showing how to add a box/frame around the individual plot
-
Showing how to localize the compass directions
-
Showing how to set customized colors for the ranges
Example 21.11. (windrose_ex5.php)
1 2 3 4 5 6 7 8 9 10 11 12 13 14 15 16 17 18 19 20 21 22 23 24 25 26 27 28 29 30 31 32 33 34 35 36 37 38 39 40 41 42 43 44 45 46 47 48 49 50 51 52 53 54 55 56 57 58 59 60 61 62 63 64 65 66 67 68 69 70 71 72 73 74 75 76 77 78 79 80 81 82 83 84 85 86 87 88 89 90 91 92 93 | require_once ('jpgraph/jpgraph.php'); require_once ('jpgraph/jpgraph_windrose.php'); // Data $data = array( 0 => array(1,1,2.5,4), 1 => array(3,4,1,4), 3 => array(2,7,4,4,3), 5 => array(2,7,1,2)); // Text to be added. $txt=array(); $txt[0] = "It is possible to add arbitrary,multi line, text to a graph. "; $txt[0] .= "Such a paragraph can have it's text be left, right or center "; $txt[0] .= "aligned."; $txt[1] = "This is an example of a right aligned paragraph."; $txt[2] = "Finally we can show a center aligned paragraph without box."; // We store the layout for each of the text boxes in an array // to keep the code clean $txtlayout = array( array(0.97,0.15,25,'left','black','lightblue'), array(0.97,0.4,20,'right','black','lightblue'), array(0.97,0.7,20,'center','darkred',false,FF_COMIC,FS_NORMAL,12), ); // Range colors to be used $rangeColors = array('silver','khaki','orange','brown','blue','navy','maroon','red'); // First create a new windrose graph with a title $graph = new WindroseGraph(570,430); $graph->title->Set('Windrose example 5'); $graph->title->SetFont(FF_VERDANA,FS_BOLD,12); $graph->title->SetColor('navy'); // Setup graph background color $graph->SetColor('darkgreen@0.7'); // Setup all the defined text boxes $n = count($txt); for( $i=0; $i < $n; ++$i ) { $txtbox[$i] = new Text($txt[$i]); $txtbox[$i]->SetPos($txtlayout[$i][0],$txtlayout[$i][1],'right'); $txtbox[$i]->SetWordwrap($txtlayout[$i][2]); $txtbox[$i]->SetParagraphAlign($txtlayout[$i][3]); $txtbox[$i]->SetColor($txtlayout[$i][4]); $txtbox[$i]->SetBox($txtlayout[$i][5]); if( count($txtlayout[$i]) > 6 ) $txtbox[$i]->SetFont($txtlayout[$i][6],$txtlayout[$i][7],$txtlayout[$i][8]); } $graph->Add($txtbox); // Create the windrose plot. $wp = new WindrosePlot($data); // Set background color for plot area $wp->SetColor('lightyellow'); // Add a box around the plot $wp->SetBox(); // Setup the colors for the ranges $wp->SetRangeColors($rangeColors); // Adjust the font and font color for scale labels $wp->scale->SetFont(FF_ARIAL,FS_NORMAL,9); $wp->scale->SetFontColor('navy'); // Set the diameter and position for plot $wp->SetSize(190); $wp->SetPos(0.35,0.53); $wp->SetZCircleSize(0.2); // Adjust the font and font color for compass directions $wp->SetFont(FF_ARIAL,FS_NORMAL,10); $wp->SetFontColor('darkgreen'); // Adjust the margin to the compass directions $wp->SetLabelMargin(50); // Adjust grid colors $wp->SetGridColor('silver','blue'); // Add (m/s) text to legend $wp->legend->SetText('(m/s)'); $wp->legend->SetMargin(20,5); // Add plot and send back to client $graph->Add($wp); $graph->Stroke(); |
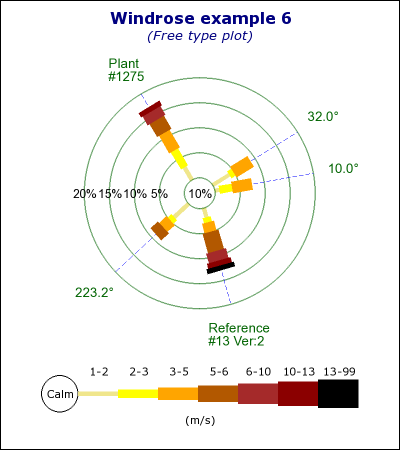
Objectives:
-
Set range colors
-
Set grid colors
-
Showing how to adjust the label margin
-
Showing how to change the format for displayed legend values
Example 21.12. (windrose_ex6.php)
1 2 3 4 5 6 7 8 9 10 11 12 13 14 15 16 17 18 19 20 21 22 23 24 25 26 27 28 29 30 31 32 33 34 35 36 37 38 39 40 41 42 43 44 45 46 47 48 49 50 51 52 53 54 55 56 57 58 59 60 61 62 63 64 65 66 67 68 69 70 71 | require_once ('jpgraph/jpgraph.php'); require_once ('jpgraph/jpgraph_windrose.php'); // Data can be specified using both ordinal index of the axis // as well as the direction label $data = array( '10' => array(1,1,2.5,4), '32.0' => array(3,4,1,4), '120.5' => array(2,3,4,4,3,2,1), '223.2' => array(2,4,1,2,2), '285.7' => array(2,2,1,2,4,2,1,1) ); // Specify text for direction labels $labels = array( '120.5' => "Plant\n#1275", '285.7' => "Reference\n#13 Ver:2"); // Range colors to be used $rangeColors = array('khaki','yellow','orange','orange:0.7','brown','darkred','black'); // First create a new windrose graph with a title $graph = new WindroseGraph(400,450); // Setup titles $graph->title->Set('Windrose example 6'); $graph->title->SetFont(FF_VERDANA,FS_BOLD,12); $graph->title->SetColor('navy'); $graph->subtitle->Set('(Free type plot)'); $graph->subtitle->SetFont(FF_VERDANA,FS_ITALIC,10); $graph->subtitle->SetColor('navy'); // Create the windrose plot. $wp = new WindrosePlot($data); // Setup a free plot $wp->SetType(WINDROSE_TYPEFREE); // Setup labels $wp->SetLabels($labels); $wp->SetLabelPosition(LBLPOSITION_CENTER); $wp->SetLabelMargin(30); // Setup the colors for the ranges $wp->SetRangeColors($rangeColors); // Adjust the font and font color for scale labels $wp->scale->SetFont(FF_ARIAL,FS_NORMAL,9); // Set the diameter and position for plot $wp->SetSize(230); $wp->SetZCircleSize(30); // Adjust the font and font color for compass directions $wp->SetFont(FF_ARIAL,FS_NORMAL,10); $wp->SetFontColor('darkgreen'); // Adjust grid colors $wp->SetGridColor('darkgreen@0.7','blue'); // Add (m/s) text to legend $wp->legend->SetText('(m/s)'); // Display legend values with no decimals $wp->legend->SetFormat('%d'); // Add plot to graph and send back to the client $graph->Add($wp); $graph->Stroke(); |
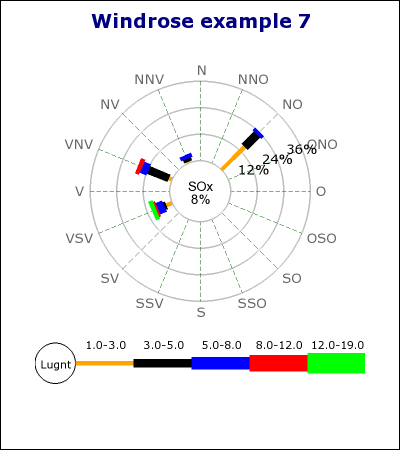
Objectives:
-
Showing how to change the direction labels
-
Adjust the displayed ranges
-
Showing how to change the format for displayed legend values
-
Showing how to manually setting the scale range and scale step size
Example 21.13. (windrose_ex7.php)
1 2 3 4 5 6 7 8 9 10 11 12 13 14 15 16 17 18 19 20 21 22 23 24 25 26 27 28 29 30 31 32 33 34 35 36 37 38 39 40 41 42 43 44 45 46 47 48 49 50 | require_once ('jpgraph/jpgraph.php'); require_once ('jpgraph/jpgraph_windrose.php'); $data = array( 2 => array(1,15,7.5,2), 5 => array(1,1,1.5,2), 7 => array(1,2,10,3,2), 9 => array(2,3,1,3,1,2), ); // First create a new windrose graph with a title $graph = new WindroseGraph(400,450); $graph->title->Set('Windrose example 7'); $graph->title->SetFont(FF_VERDANA,FS_BOLD,14); $graph->title->SetColor('navy'); // Create the free windrose plot. $wp = new WindrosePlot($data); $wp->SetType(WINDROSE_TYPE16); // Add some "arbitrary" text to the center $wp->scale->SetZeroLabel("SOx\n8%%"); // Localize the compass direction labels into Swedish // Note: The labels for data must now also match the exact // string for the compass directions. $se_CompassLbl = array('O','ONO','NO','NNO','N','NNV','NV','VNV', 'V','VSV','SV','SSV','S','SSO','SO','OSO'); $wp->SetCompassLabels($se_CompassLbl); // Localize the "Calm" text into Swedish and make the circle // slightly bigger than default $se_calmtext = 'Lugnt'; $wp->legend->SetCircleText($se_calmtext); $wp->legend->SetCircleRadius(20); // Adjust the displayed ranges $ranges = array(1,3,5,8,12,19,29); $wp->SetRanges($ranges); //$wp->SetAntiAlias(true); // Set the scale to always have max value of 30 with a step // size of 12. $wp->scale->Set(30,12); // Finally add it to the graph and send back to client $graph->Add($wp); $graph->Stroke(); |
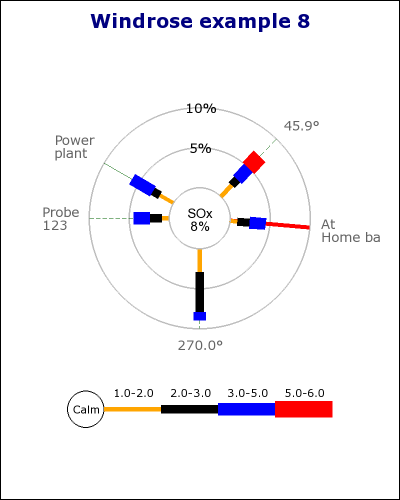
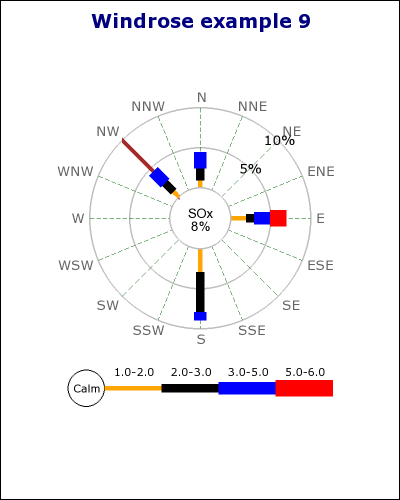
Objectives:
-
Different styles of radial grid lines for a type 8 plot
-
Adding partial labels
Example 21.14. Show how to set different styles for individual radial grid lines (windrose_ex8.php)
1 2 3 4 5 6 7 8 9 10 11 12 13 14 15 16 17 18 19 20 21 22 23 24 25 26 27 28 29 30 31 32 33 34 35 36 37 38 39 40 41 42 43 44 45 46 47 | require_once ('jpgraph/jpgraph.php'); require_once ('jpgraph/jpgraph_windrose.php'); // Data can be specified using both ordinal index of the axis // as well as the direction label. $data = array( '45.9' => array(3,2,1,2,2), 355 => array(1,1,1.5,2), 180 => array(1,1,1.5,2), 150 => array(1,2,1,3), 'S' => array(2,3,5,1), ); // Add some labels for afew of the directions $labels = array(355=>"At\nHome base",180=>"Probe\n123",150=>"Power\nplant"); // Define the color,weight and style of some individual radial grid lines. $axiscolors = array(355=>"red"); $axisweights = array(355=>8); $axisstyles = array(355=>'solid',150=>'solid'); // First create a new windrose graph with a title $graph = new WindroseGraph(400,500); $graph->title->Set('Windrose example 8'); $graph->title->SetFont(FF_VERDANA,FS_BOLD,14); $graph->title->SetColor('navy'); // Create the free windrose plot. $wp = new WindrosePlot($data); $wp->SetType(WINDROSE_TYPEFREE); // Specify colors weights and style for the radial gridlines $wp->SetRadialColors($axiscolors); $wp->SetRadialWeights($axisweights); $wp->SetRadialStyles($axisstyles); // Add a few labels $wp->SetLabels($labels); // Add some "arbitrary" text to the center $wp->scale->SetZeroLabel("SOx\n8%%"); // Finally add it to the graph and send back to client $graph->Add($wp); $graph->Stroke(); |
Objectives:
-
Set radial grids for a type 16 plot
Example 21.15. (windrose_ex9.php)
1 2 3 4 5 6 7 8 9 10 11 12 13 14 15 16 17 18 19 20 21 22 23 24 25 26 27 28 29 30 31 32 33 34 35 36 37 38 39 40 41 42 43 44 45 | require_once ('jpgraph/jpgraph.php'); require_once ('jpgraph/jpgraph_windrose.php'); // Data can be specified using both ordinal index of the axis // as well as the direction label. $data = array( 'E' => array(3,2,1,2,2), 'N' => array(1,1,1.5,2), 'nw' => array(1,1,1.5,2), 'S' => array(2,3,5,1), ); // Define the color,weight and style of some individual radial // grid lines. Axis can be specified either by their (localized) // label or by their index. // Note; Depending on how many axis you have in the plot the // index will vary between 0..n where n is the number of // compass directions. $axiscolors = array('nw'=>'brown'); $axisweights = array('nw'=>8); // Could also be specified as 6 => 8 $axisstyles = array('nw'=>'solid'); // First create a new windrose graph with a title $graph = new WindroseGraph(400,500); $graph->title->Set('Windrose example 9'); $graph->title->SetFont(FF_VERDANA,FS_BOLD,14); $graph->title->SetColor('navy'); // Create the free windrose plot. $wp = new WindrosePlot($data); $wp->SetType(WINDROSE_TYPE16); // Specify colors weights and style for the radial gridlines $wp->SetRadialColors($axiscolors); $wp->SetRadialWeights($axisweights); $wp->SetRadialStyles($axisstyles); // Add some "arbitrary" text to the center $wp->scale->SetZeroLabel("SOx\n8%%"); // Finally add it to the graph and send back to the client $graph->Add($wp); $graph->Stroke(); |
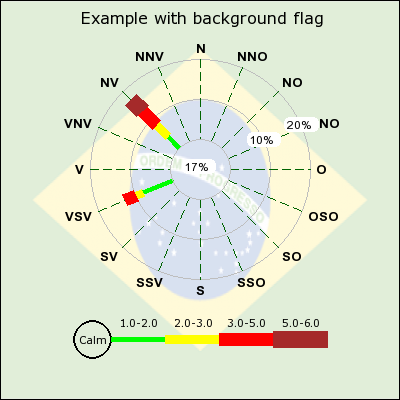
Objectives:
-
Showing how to add a background image which is one of the country flags
Example 21.16. (windrose_bgimg_ex1.php)
1 2 3 4 5 6 7 8 9 10 11 12 13 14 15 16 17 18 19 20 21 22 23 24 25 26 27 28 29 30 31 32 33 34 35 36 37 38 39 40 41 42 43 44 45 46 47 48 49 | require_once ('jpgraph/jpgraph.php'); require_once ('jpgraph/jpgraph_windrose.php'); require_once ('jpgraph/jpgraph_flags.php'); // Data can be specified using both ordinal idex of axis as well // as the direction label $data2 = array( 'vsv' => array(12,8,2,3), 6 => array(5,4,4,5,4), ); $se_CompassLbl = array('O','ONO','NO','NNO','N','NNV','NV','VNV','V','VSV','SV','SSV','S','SSO','SO','OSO'); // Create a new small windrose graph $graph = new WindroseGraph(400,400); $graph->SetMargin(25,25,25,25); $graph->SetFrame(); $graph->title->Set('Example with background flag'); #$graph->title->SetFont(FF_VERA,FS_BOLD,14); //$graph->SetBackgroundImage('bkgimg.jpg',BGIMG_FILLFRAME); //$graph->SetBackgroundImageMix(90); $graph->SetBackgroundCFlag(28,BGIMG_FILLFRAME,15); $wp2 = new WindrosePlot($data2); $wp2->SetType(WINDROSE_TYPE16); $wp2->SetSize(0.55); $wp2->SetPos(0.5,0.5); $wp2->SetAntiAlias(false); $wp2->SetFont(FF_ARIAL,FS_BOLD,10); $wp2->SetFontColor('black'); $wp2->SetCompassLabels($se_CompassLbl); $wp2->legend->SetMargin(20,5); $wp2->scale->SetZFont(FF_ARIAL,FS_NORMAL,8); $wp2->scale->SetFont(FF_ARIAL,FS_NORMAL,9); $wp2->scale->SetLabelFillColor('white','white'); $wp2->SetRangeColors(array('green','yellow','red','brown')); $graph->Add($wp2); $graph->Stroke(); |
