<html><head><meta http-equiv="Content-Type" content="text/html; charset=UTF-8"><title>The Init() method</title><link rel="stylesheet" type="text/css" href="manual.css"><meta name="generator" content="DocBook XSL Stylesheets V1.76.0"><link rel="home" href="index.html" title="JpGraph Manual"><link rel="up" href="ch35.html" title="Chapter 35. Creating Critical chain buffer penetration charts"></head><body bgcolor="white" text="black" link="#0000FF" vlink="#840084" alink="#0000FF"><div class="navheader"><table width="100%" summary="Navigation header"><tr><th colspan="3" align="center">The Init() method</th></tr><tr><td width="20%" align="left"> </td><th width="60%" align="center">Chapter 35. Creating Critical chain buffer penetration charts</th><td width="20%" align="right"> </td></tr></table><hr></div><div class="sect1" title="The Init() method"><div class="titlepage"><div><div><h2 class="title" style="clear: both"><a name="id2621746"></a>The Init() method</h2></div></div></div> <p>This is the real method that actually constructs the graph. While we will not go through every single line in details we will highlight the complications and some formatting options we have used.</p> <div class="section" title="Creating the colored backgrounds"><div class="titlepage"><div><div><h2 class="title" style="clear: both"><a name="id2622039"></a>Creating the colored backgrounds</h2></div></div></div> <p>In order to create the colored background we create filled area plots and add them to the graph. Starting with the "brown" and successively adding the rest to create the colored band effect we want. <a class="xref" href="ch35s03.html#fig.ccbp-background-step" title="Figure 35.6. Steps to create the background">Figure 35.6. Steps to create the background</a> shows in "slow-motion" how this is done by adding four area plots, one at a time.</p> <div class="figure"><a name="fig.ccbp-background-step"></a><p class="title"><b>Figure 35.6. Steps to create the background</b></p><div class="figure-contents"> <div class="mediaobject"><img src="images/ccbp-creating-background-indicators.png" alt="Steps to create the background"></div> </div></div><br class="figure-break"> <p>
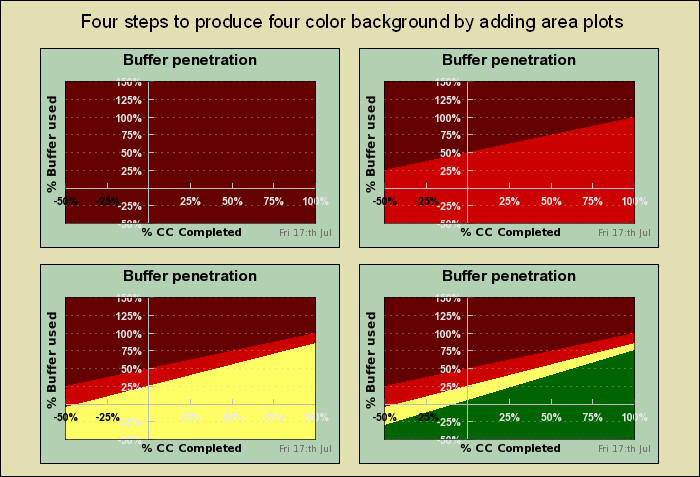
The exact position for the lines are calculated with the positions given for each color band. The position for each color band is specified by giving the y-coordinate at x=0 and the y-coordinate at the maximum x-scale value.</p> <p>When adding the area plots there is one thing we have to modify. By default the fill is done between the line and the y=0 line. In our case we need the fill to go all the way down to the min y-value. To change this behavior we need to call the method</p> <p> </p><div class="itemizedlist"><ul class="itemizedlist" type="disc"><li class="listitem"> <p><code class="code">LinePlot::SetFillFromYMin()</code></p> </li></ul></div><p> </p> <p>for each of the areas.</p> </div> </div><div class="navfooter"><hr><table width="100%" summary="Navigation footer"><tr><td width="40%" align="left"> </td><td width="20%" align="center"><a accesskey="u" href="ch35.html">Up</a></td><td width="40%" align="right"> </td></tr><tr><td width="40%" align="left" valign="top"> </td><td width="20%" align="center"><a accesskey="h" href="index.html">Home</a></td><td width="40%" align="right" valign="top"> </td></tr></table></div></body></html>