<html><head><meta http-equiv="Content-Type" content="text/html; charset=UTF-8"><title>Using multiple y-axis</title><link rel="stylesheet" type="text/css" href="manual.css"><meta name="generator" content="DocBook XSL Stylesheets V1.76.0"><link rel="home" href="index.html" title="JpGraph Manual"><link rel="up" href="ch14.html" title="Chapter 14. Common features for all Cartesian (x,y) graph types"></head><body bgcolor="white" text="black" link="#0000FF" vlink="#840084" alink="#0000FF"><div class="navheader"><table width="100%" summary="Navigation header"><tr><th colspan="3" align="center">Using multiple y-axis</th></tr><tr><td width="20%" align="left"> </td><th width="60%" align="center">Chapter 14. Common features for all Cartesian (x,y) graph types</th><td width="20%" align="right"> </td></tr></table><hr></div><div class="sect1" title="Using multiple y-axis"><div class="titlepage"><div><div><h2 class="title" style="clear: both"><a name="sec1.multiple-yaxis"></a>Using multiple y-axis</h2></div></div></div> <p>With this feature an arbitrary number of Y-axis can be added to the right side of the graph. The library itself doesn't impose any restrictions on the number of extra Y-axis but from a practical concern it is most likely very difficult to interpret a graph with more than 2-3 extra y-axis. </p> <p>If there is only need for one more Y axis then the concept of the additional Y2 axis is available as a convenient shortcut for this the most common use of an extra y-axis. The Y2 axis is also a first class citizen in the library meaning it has all the properties available to the "normal" Y-axis. </p> <p>These extra axis inherits most of the properties of the normal Y-axis (but not all) and the few restrictions imposed are described in <a class="xref" href="ch14s06.html#sec2.mulyaxis-restriction" title="Restrictions with multiple y-axis">Restrictions with multiple y-axis</a> below. </p> <p><a class="xref" href="ch14s06.html#fig.mulyaxisex1" title="Figure 14.17. Basic example of multiple y-axis (mulyaxisex1.php)">Figure 14.17. Basic example of multiple y-axis <code class="uri"><a class="uri" href="example_src/mulyaxisex1.html" target="_top">(<code class="filename">mulyaxisex1.php</code>)</a></code> </a> shows a basic example of how to use this feature. The color encoding maps a specific line to the corresponding axis.</p> <p> </p><div class="figure"><a name="fig.mulyaxisex1"></a><p class="title"><b>Figure 14.17. Basic example of multiple y-axis <code class="uri"><a class="uri" href="example_src/mulyaxisex1.html" target="_top">(<code class="filename">mulyaxisex1.php</code>)</a></code> </b></p><div class="figure-contents"> <span class="inlinemediaobject"><img src="images/mulyaxisex1.png" alt="Basic example of multiple y-axis (mulyaxisex1.php)"></span> </div></div><p><br class="figure-break"> </p> <div class="sect2" title="Adding additional y-axis"><div class="titlepage"><div><div><h3 class="title"><a name="id2544595"></a>Adding additional y-axis</h3></div></div></div> <p>
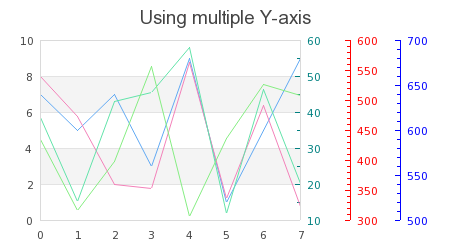
Adding additional Y-axis is very similar to the way standard Y axis work. The Y-axis are numbered [0..n] where the 0:th axis is the Y-axis furthest to the left. At the same time as these additional Y-axis are used it is also possible to add a Y2 axis. The difference being that the Y2 axis can have all the same options as the Y axis. </p> <p>For basic usage only three new methods are needed </p> <p> </p><div class="orderedlist"><ol class="orderedlist" type="1"><li class="listitem"> <p><code class="code">Graph::SetYScale($aNbr,$aScaleType,$aMin,$aMax)</code> </p> <p>Specifies the type of scale ('lin', 'int' or 'log') to use for the axis number '<code class="code">$aNbr'</code> </p> </li><li class="listitem"> <p><code class="code">Graph::AddY($aNbr,$aPlot) </code></p> <p>Add a plot to axis number <code class="code">'$aNbr' </code></p> </li><li class="listitem"> <p><code class="code">Graph::SetYDeltaDist($aDistance) </code></p> <p>This is an optional method that if used specifies the default number of pixels between each additional Y-axis. This value will be used unless a specific position for the N:th axis has been specified. By default the additional Y-axis are separated with 50 pixels (which is what is used in <a class="xref" href="ch14s06.html#fig.mulyaxisex1" title="Figure 14.17. Basic example of multiple y-axis (mulyaxisex1.php)">Figure 14.17. Basic example of multiple y-axis <code class="uri"><a class="uri" href="example_src/mulyaxisex1.html" target="_top">(<code class="filename">mulyaxisex1.php</code>)</a></code> </a> </p> </li></ol></div><p> </p> <p>In order to initialize the extra y-axis the method SetYScale() must be called. In <a class="xref" href="ch14s06.html#fig.mulyaxisex1" title="Figure 14.17. Basic example of multiple y-axis (mulyaxisex1.php)">Figure 14.17. Basic example of multiple y-axis <code class="uri"><a class="uri" href="example_src/mulyaxisex1.html" target="_top">(<code class="filename">mulyaxisex1.php</code>)</a></code> </a> the following lines are used</p> <p> </p><div class="hl-main"><table class="hl-table" width="100%"><tr><td class="hl-gutter" align="right" valign="top"><pre>1 2 3 </pre></td><td class="hl-main" valign="top"><pre><span class="hl-code">$graph->SetYScale(0,'lin'); $graph->SetYScale(1,'lin'); $graph->SetYScale(2,'lin');</span></pre></td></tr></table></div><p> </p> <p>Once setup these additional Y-axis are accessed through the array </p> <p><code class="code">Graph::ynaxis[] </code></p> <p>The axis are numbered from 0. By accessing the axis through this array most of the same method as for the usual Y and Y2 axis are available. For example, the line below will set the color of axis number 1 </p> <p> </p><div class="hl-main"><table class="hl-table" width="100%"><tr><td class="hl-gutter" align="right" valign="top"><pre>1 </pre></td><td class="hl-main" valign="top"><pre><span class="hl-code">$graph->ynaxis[1]->SetColor('red');</span></pre></td></tr></table></div><p> </p> <p>Finally the plots are added to a specific axis with a call to the method <code class="code">AddY()</code> (as opposed to the regular <code class="code">Add()</code> or <code class="code">AddY2()</code> methods). The first argument must be an ordinal that specified the number of the axis that the plot should be added to.</p> </div> <div class="sect2" title="Using CSIM together with multiple y-axis"><div class="titlepage"><div><div><h3 class="title"><a name="id2544637"></a>Using CSIM together with multiple y-axis</h3></div></div></div> <p>
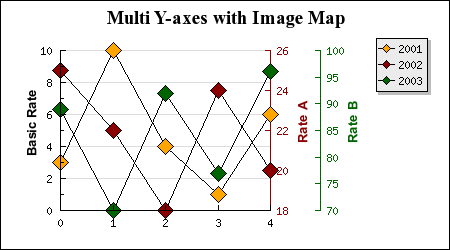
Client Side Image Maps is fully supported and is used in the same way as CSIM for the basic Y-axis. A short example will clarify this. The following code snippet shows a line plot where we have added some oversized markers (in the shape of diamonds) that will act as the image map areas for each data series</p> <p> </p><div class="hl-main"><table class="hl-table" width="100%"><tr><td class="hl-gutter" align="right" valign="top"><pre>1 2 3 4 5 6 7 8 9 </pre></td><td class="hl-main" valign="top"><pre><span class="hl-inlinetags"><?php</span><span class="hl-code"> ... </span><span class="hl-var">$lp2</span><span class="hl-code"> = </span><span class="hl-reserved">new</span><span class="hl-code"> </span><span class="hl-identifier">LinePlot</span><span class="hl-brackets">(</span><span class="hl-var">$datay2</span><span class="hl-brackets">)</span><span class="hl-code">; </span><span class="hl-var">$lp2</span><span class="hl-code">-></span><span class="hl-identifier">mark</span><span class="hl-code">-></span><span class="hl-identifier">SetType</span><span class="hl-brackets">(</span><span class="hl-identifier">MARK_DIAMOND</span><span class="hl-brackets">)</span><span class="hl-code">; </span><span class="hl-var">$lp2</span><span class="hl-code">-></span><span class="hl-identifier">mark</span><span class="hl-code">-></span><span class="hl-identifier">SetWidth</span><span class="hl-brackets">(</span><span class="hl-number">15</span><span class="hl-brackets">)</span><span class="hl-code">; </span><span class="hl-var">$lp2</span><span class="hl-code">-></span><span class="hl-identifier">SetCSIMTargets</span><span class="hl-brackets">(</span><span class="hl-var">$targ2</span><span class="hl-code">,</span><span class="hl-var">$alts2</span><span class="hl-brackets">)</span><span class="hl-code">; </span><span class="hl-var">$graph</span><span class="hl-code">-></span><span class="hl-identifier">AddY</span><span class="hl-brackets">(</span><span class="hl-number">0</span><span class="hl-code">,</span><span class="hl-var">$lp2</span><span class="hl-brackets">)</span><span class="hl-code">; ... </span><span class="hl-inlinetags">?></span></pre></td></tr></table></div><p> </p> <p>As usual the targets for the image maps are specified with a call to <code class="code">Plot::SetCSIMTargets()</code>. An example of CSIM with multiple y-axis is included in the Example directory and the resulting image is reproduced in <a class="xref" href="ch14s06.html#fig.mulyaxis_csim_static" title="Figure 14.18. Illustration of mulyaxiscsimex1.php">Figure 14.18. Illustration of <code class="uri"><a class="uri" href="example_src/mulycsim_example_static.html" target="_top">mulyaxiscsimex1.php</a></code></a> (but just as an image not as a CSIM image)</p> <p> </p><div class="figure"><a name="fig.mulyaxis_csim_static"></a><p class="title"><b>Figure 14.18. Illustration of <code class="uri"><a class="uri" href="example_src/mulycsim_example_static.html" target="_top">mulyaxiscsimex1.php</a></code></b></p><div class="figure-contents"> <div class="mediaobject"><img src="images/mulycsim_example_static.png" alt="Illustration of mulyaxiscsimex1.php"></div> </div></div><p><br class="figure-break"> </p> </div> <div class="sect2" title="Restrictions with multiple y-axis"><div class="titlepage"><div><div><h3 class="title"><a name="sec2.mulyaxis-restriction"></a>Restrictions with multiple y-axis</h3></div></div></div> <p> </p><div class="itemizedlist"><ul class="itemizedlist" type="disc"><li class="listitem"> <p>Only standard plots can be added to the extra Y-axis, this means no Text objects, no PlotBand, no PlotLines, no Icons etc </p> </li><li class="listitem"> <p>No Grid lines can not be added to the extra Y-axis </p> </li></ul></div><p> </p> </div> </div><div class="navfooter"><hr><table width="100%" summary="Navigation footer"><tr><td width="40%" align="left"> </td><td width="20%" align="center"><a accesskey="u" href="ch14.html">Up</a></td><td width="40%" align="right"> </td></tr><tr><td width="40%" align="left" valign="top"> </td><td width="20%" align="center"><a accesskey="h" href="index.html">Home</a></td><td width="40%" align="right" valign="top"> </td></tr></table></div></body></html>