<html><head><meta http-equiv="Content-Type" content="text/html; charset=UTF-8"><title>Some more advanced formatting</title><link rel="stylesheet" type="text/css" href="manual.css"><meta name="generator" content="DocBook XSL Stylesheets V1.76.0"><link rel="home" href="index.html" title="JpGraph Manual"><link rel="up" href="ch21.html" title="Chapter 21. Windrose"></head><body bgcolor="white" text="black" link="#0000FF" vlink="#840084" alink="#0000FF"><div class="navheader"><table width="100%" summary="Navigation header"><tr><th colspan="3" align="center">Some more advanced formatting</th></tr><tr><td width="20%" align="left"> </td><th width="60%" align="center">Chapter 21. Windrose</th><td width="20%" align="right"> </td></tr></table><hr></div><div class="sect1" title="Some more advanced formatting"><div class="titlepage"><div><div><h2 class="title" style="clear: both"><a name="id2589154"></a>Some more advanced formatting</h2></div></div></div> <div class="sect2" title="Turning off Anti-aliasing"><div class="titlepage"><div><div><h3 class="title"><a name="id2589161"></a>Turning off Anti-aliasing</h3></div></div></div> <p>By default anti-aliasing is enabled. This has a speed penalty together with restrictions that no background images can be used in this version of the library. </p> <p>If you want to use background images or improve performance anti-aliasing can be turned off with a call to the method </p> <p> </p><div class="itemizedlist"><ul class="itemizedlist" type="disc"><li class="listitem"> <p><code class="code">WindrosePlot::SetAntiAlias($aFlag)</code></p> </li></ul></div><p> </p> </div> <div class="sect2" title="More on formatting scale-labels"><div class="titlepage"><div><div><h3 class="title"><a name="id2589188"></a>More on formatting scale-labels</h3></div></div></div> <p>Since scale labels are normal text element all normal text formatting can be used to enhance the look &feel of the scale labels. </p> <div class="sect3" title="Adding background colors"><div class="titlepage"><div><div><h4 class="title"><a name="id2589207"></a>Adding background colors</h4></div></div></div> <p>A simple enhancement to make the labels more visible is to add a box and a background color for the label. This is done with a call to the method </p> <p> </p><div class="itemizedlist"><ul class="itemizedlist" type="disc"><li class="listitem"> <p><code class="code">WindrosePlotScale::SetLabelFillColor($aFillColor, $aColor)</code></p> </li></ul></div><p> </p> <p>The following code snippet shows how this could be done </p> <p> </p><div class="hl-main"><table class="hl-table" width="100%"><tr><td class="hl-gutter" align="right" valign="top"><pre>1 </pre></td><td class="hl-main" valign="top"><pre><span class="hl-code">$windplot->scale->SetLabelFillColor('lightblue','black');</span></pre></td></tr></table></div><p> </p> <p> </p><div class="figure"><a name="fig.windrose_ex8.1"></a><p class="title"><b>Figure 21.13. Adding label background <code class="uri"><a class="uri" href="example_src/windrose_ex8.1.html" target="_top">(<code class="filename">windrose_ex8.1.php</code>)</a></code> </b></p><div class="figure-contents"> <span class="inlinemediaobject"><img src="images/windrose_ex8.1.png" alt="Adding label background (windrose_ex8.1.php)"></span> </div></div><p><br class="figure-break"> </p> </div> <div class="sect3" title="Adjusting the alignment of the scale labels"><div class="titlepage"><div><div><h4 class="title"><a name="id2589251"></a>Adjusting the alignment of the scale labels</h4></div></div></div> <p>
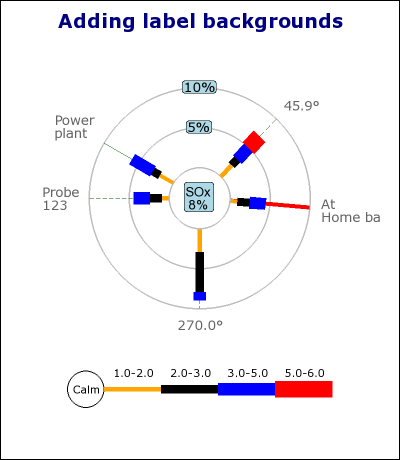
By default the scale labels are centered on the intersection between the radial line and the grid circle. It is possible to also have the label positioned slightly outside the circular grid. This is all controlled by the method </p> <p> </p><div class="itemizedlist"><ul class="itemizedlist" type="disc"><li class="listitem"> <p><code class="code">WindrosePlotScale::SetLabelAlign($aAlign)</code></p> <p>Possible values for <code class="code">$aAlign</code> are</p> <p> </p><div class="itemizedlist"><ul class="itemizedlist" type="circle"><li class="listitem"> <p>LBLALIGN_CENTER, The default. Center the label</p> </li><li class="listitem"> <p>LBLALIGN_TOP, Optional. Position the label slightly outside the circular grid line.</p> </li></ul></div><p> </p> </li></ul></div><p> </p> </div> <div class="sect3" title="Specifying number formats"><div class="titlepage"><div><div><h4 class="title"><a name="id2589318"></a>Specifying number formats</h4></div></div></div> <p>The final formatting option is to specify the number format of the label. This is specified as an ordinary "<code class="code">printf()</code>" format string. The format is specified with a call to </p> <p> </p><div class="itemizedlist"><ul class="itemizedlist" type="disc"><li class="listitem"> <p><code class="code">WindrosePlotScale::SetLabelFormat($aFmt)</code></p> </li></ul></div><p> </p> <p>For example the code snippet below makes the label display 1 decimal and adding a '%' sign. </p> <p> </p><div class="hl-main"><table class="hl-table" width="100%"><tr><td class="hl-gutter" align="right" valign="top"><pre>1 </pre></td><td class="hl-main" valign="top"><pre><span class="hl-code">$windroseplot->scale->SetLabelFormat('%.1f%%');</span></pre></td></tr></table></div><p> </p> </div> <div class="sect3" title="Hiding the labels"><div class="titlepage"><div><div><h4 class="title"><a name="id2589396"></a>Hiding the labels</h4></div></div></div> <p>Finally it is possible to completely hide the scale labels with a call to </p> <p> </p><div class="itemizedlist"><ul class="itemizedlist" type="disc"><li class="listitem"> <p><code class="code">WindrosePlotScale::Hide($aFlg=true)</code></p> </li></ul></div><p> </p> </div> </div> <div class="sect2" title="Formatting the legend"><div class="titlepage"><div><div><h3 class="title"><a name="id2589422"></a>Formatting the legend </h3></div></div></div> <p>All the property for the legend is access through the legend property of the windrose plot as shown in the examples below. </p> <div class="sect3" title="Turning off the legend"><div class="titlepage"><div><div><h4 class="title"><a name="id2589434"></a>Turning off the legend</h4></div></div></div> <p>By default the legend is shown for each plot. It can be turned off with a call to </p> <p> </p><div class="itemizedlist"><ul class="itemizedlist" type="disc"><li class="listitem"> <p><code class="code">LegendStyle::Hide()</code></p> </li></ul></div><p> </p> <p>as the following code snippet shows. </p> <p> </p><div class="hl-main"><table class="hl-table" width="100%"><tr><td class="hl-gutter" align="right" valign="top"><pre>1 </pre></td><td class="hl-main" valign="top"><pre><span class="hl-code">$windroseplot->legend->Hide();</span></pre></td></tr></table></div><p> </p> </div> <div class="sect3" title="Adjusting the legend position"><div class="titlepage"><div><div><h4 class="title"><a name="id2589474"></a>Adjusting the legend position</h4></div></div></div> <p>In version 1.0 of Windrose plot it is not possible to fully adjust the position of the plot legend. However, it is possible to manually adjust the margin between</p> <p> </p><div class="itemizedlist"><ul class="itemizedlist" type="disc"><li class="listitem"> <p>the Windrose plot and the legend</p> </li><li class="listitem"> <p>... the bottom of the box around a single plot and the legend</p> </li></ul></div><p> </p> <p>Both these margins are adjusted with a call to </p> <p> </p><div class="itemizedlist"><ul class="itemizedlist" type="disc"><li class="listitem"> <p><code class="code">Legend::SetMargin($aMarg,$aBottomMargin=5)</code></p> </li></ul></div><p> </p> <p>For example by adding the following lines to your script </p> <p> </p><div class="hl-main"><table class="hl-table" width="100%"><tr><td class="hl-gutter" align="right" valign="top"><pre>1 </pre></td><td class="hl-main" valign="top"><pre><span class="hl-code">$windroseplot->legend->SetMargin(25);</span></pre></td></tr></table></div><p> </p> <p>By default this margin to the Windrose plot is 10 pixels and to the bottom of the plot box it is 5 pixels. Note that the legend positioning will automatically adjust for any increase in the font size for the compass directions to ensure that the legend will never collide with the labels when large fonts are used.</p> </div> <div class="sect3" title="Adjusting the length of each legend window leg"><div class="titlepage"><div><div><h4 class="title"><a name="id2589551"></a>Adjusting the length of each legend window leg</h4></div></div></div> <p>By default the length of each legend leg is just long enough (with a little bit to spare) to cover the range labels just on top of the legend legs. It can never be set to smaller than that but it can be made larger with a call to </p> <p> </p><div class="itemizedlist"><ul class="itemizedlist" type="disc"><li class="listitem"> <p><code class="code">LegendStyle::SetLength($aLength)</code></p> </li></ul></div><p> </p> </div> <div class="sect3" title="Adjusting how the range is displayed"><div class="titlepage"><div><div><h4 class="title"><a name="id2589570"></a>Adjusting how the range is displayed</h4></div></div></div> <p>
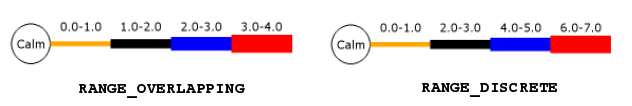
By default the range labels is displayed so that the end label of bucket <span class="italic">n</span> is the same as the start label in bucket (<span class="italic">n+1</span>). This behaviour can be controlled with the method</p> <p> </p><div class="itemizedlist"><ul class="itemizedlist" type="disc"><li class="listitem"> <p><code class="code">WindrosePlot::SetRangeStyle($aStyle)</code></p> <p><code class="code">$aStyle</code>, is one of two symbolic constants</p> <p> </p><div class="orderedlist"><ol class="orderedlist" type="1"><li class="listitem"> <p><code class="code">RANGE_OVERLAPPING</code>, (The default)</p> </li><li class="listitem"> <p><code class="code">RANGE_DISCRETE</code>, The range labels will be distinct</p> </li></ol></div><p> </p> </li></ul></div><p> </p> <p><a class="xref" href="ch21s04.html#fig.windrose-legend-lstyles" title="Figure 21.14. Different legend label styles">Figure 21.14. Different legend label styles</a> shows the difference between the two legend styles</p> <div class="figure"><a name="fig.windrose-legend-lstyles"></a><p class="title"><b>Figure 21.14. Different legend label styles</b></p><div class="figure-contents"> <div class="mediaobject"><img src="images/wind-legend-styles.png" alt="Different legend label styles"></div> </div></div><br class="figure-break"> </div> </div> <div class="sect2" title="Highlighting specific compass directions"><div class="titlepage"><div><div><h3 class="title"><a name="id2589687"></a>Highlighting specific compass directions</h3></div></div></div> <p>In order to emphasize certain directions it is possible to individually adjust the radial lines look & feel. </p> <p>For example, assume that the direction 134ยบ in a free plot is especially important. In order to emphasize this we can make the radial line, solid and red while maintaining a low profile on the other directions. </p> <p>This is easily accomplished by the use of one or more of the three plot methods </p> <p> </p><div class="itemizedlist"><ul class="itemizedlist" type="disc"><li class="listitem"> <p><code class="code">SetRadialColors($aColors)</code> </p> </li><li class="listitem"> <p><code class="code">SetRadialWeights($aWeights)</code></p> </li><li class="listitem"> <p><code class="code">SetRadialStyles($aStyles)</code></p> </li></ul></div><p> </p> <p>These method all take arrays as argument. The arrays specifies what direction and what style to use. So, for example to make the "Southwest" grid red one would add the lines </p> <p> </p><div class="hl-main"><table class="hl-table" width="100%"><tr><td class="hl-gutter" align="right" valign="top"><pre>1 2 3 4 </pre></td><td class="hl-main" valign="top"><pre><span class="hl-inlinetags"><?php</span><span class="hl-code"> </span><span class="hl-identifier">colors</span><span class="hl-code"> = </span><span class="hl-reserved">array</span><span class="hl-brackets">(</span><span class="hl-quotes">'</span><span class="hl-string">sw</span><span class="hl-quotes">'</span><span class="hl-code"> => </span><span class="hl-quotes">'</span><span class="hl-string">red</span><span class="hl-quotes">'</span><span class="hl-brackets">)</span><span class="hl-code">; </span><span class="hl-var">$windplot</span><span class="hl-code">-></span><span class="hl-identifier">SetRadialColors</span><span class="hl-brackets">(</span><span class="hl-var">$colors</span><span class="hl-brackets">)</span><span class="hl-code">; </span><span class="hl-inlinetags">?></span></pre></td></tr></table></div><p> </p> <p>As direction either the (localized) name can be used or the index/direction depending on if it is a free or regular type of windrose type. </p> <p>Any direction which hasn't been explicitly specified in the array will use the default colors (As Specified by <code class="code">SetGridColor()</code>) and the default weight (as specified by <code class="code">SetGridWeight()</code>).</p> </div> <div class="sect2" title="Including a graph in a PDF"><div class="titlepage"><div><div><h3 class="title"><a name="id2589778"></a>Including a graph in a PDF</h3></div></div></div> <p>This information assumes that the PDFlib in installed and available in the PHP setup being used. This very short paragraph is in no way a replacement for reading the full PDFlib documentation. It is just intended to give some ideas on how this can be done. This information is to large extent a repetition of what can be read in <a class="xref" href="apc.html" title="Appendix C. FAQ">Appendix C. <i>FAQ</i></a></p> <p>Instead of stroking the image to a file or back to the browser you can get hold of the internal GD handle that represents the graph. This is done by specifying the constant <code class="code">_IMG_HANDLER</code> as the file name in the call to <code class="code">Stroke()</code>. This will tell the <code class="code">Stroke()</code> method to return the GD handle.</p> <p>In order to use the GD handle together with the PDFlib the image must be loaded into memory by a call to </p> <p><code class="code">pdf_open_memory_image($pdf, $im)</code> </p> <p>The following snippet shows how you can produce and send back a PDF page to the browser. Please note that this is just a code sketch and not final code</p> <p> </p><div class="hl-main"><table class="hl-table" width="100%"><tr><td class="hl-gutter" align="right" valign="top"><pre>1 2 3 4 5 6 7 8 9 10 11 12 13 14 15 16 17 18 19 20 21 22 23 24 25 26 27 28 29 30 31 32 33 34 35 36 37 </pre></td><td class="hl-main" valign="top"><pre><span class="hl-code">... $graph = new WindroseGraph(...); // Code to create the graph // ......................... // ......................... // Put the image in a PDF page by first getting the GD handle $im = $graph->Stroke(_IMG_HANDLER); $pdf = pdf_new(); pdf_open_file($pdf, ""); // Convert the GD image to something the // PDFlibrary knows how to handle $pimg = pdf_open_memory_image($pdf, $im); // Setup a basic PDF page pdf_begin_page($pdf, 595, 842); pdf_add_outline($pdf, "Page 1"); pdf_place_image($pdf, $pimg, 0, 500, 1); pdf_close_image($pdf, $pimg); pdf_end_page($pdf); pdf_close($pdf); // Prepare to output the PDF page $buf = pdf_get_buffer($pdf); $len = strlen($buf); header("Content-type: application/pdf"); header("Content-Length: $len"); header("Content-Disposition: inline; filename=foo.pdf"); echo $buf; pdf_delete($pdf); ...</span></pre></td></tr></table></div><p> </p> </div> <div class="sect2" title="Adding a background image"><div class="titlepage"><div><div><h3 class="title"><a name="id2589844"></a>Adding a background image</h3></div></div></div> <p>In the same way as with the other types of plots in the library there is a possibility to add a background image in the graph. However, due to limitations with the way the extended anti-alias in windroses is implemented it is not possible to use background images when this (default) behavior is enabled. </p> <p>(It is technically possible to correct this limitations but the performance hit of doing this is completely unacceptable since that would require pixel-level manipulation directly in PHP with would be prohibitively CPU expensive).</p> <p>To use background images the extended anti alias feature in windrose plots must be disabled with a call to <code class="code">Windrosegraph::SetAntiAlias(false) </code></p> <p>In order to add a background image the normal method <code class="code">SetBackgroundImage()</code> is used. The following code snippet shows how this is done. </p> <p> </p><div class="hl-main"><table class="hl-table" width="100%"><tr><td class="hl-gutter" align="right" valign="top"><pre>1 </pre></td><td class="hl-main" valign="top"><pre><span class="hl-code">$graph->SetBackgroundImage('mybackground.jpg',BGIMG_FILLFRAME);</span></pre></td></tr></table></div><p> </p> <p>The above example puts the image covering the entire graph area. </p> <p>Remember that you can also adjust the mixing level of the background image with a call to <code class="code">SetBackgroundImageMix($aMixLevel)</code> This determines how much of the image is blended with the background color. An argument of 100 takes 100 percent of the image and a value of 0 is the same as not displaying the background image at all.</p> <p>An example of using a background image is shown in <a class="xref" href="ch21s07.html#sec.windrose-ex10" title="Example 10">Example 10</a></p> <p>See <a class="xref" href="ch14s15.html" title="Adding images and country flags to the background of the graph">Adding images and country flags to the background of the graph</a> for more general information on background images.</p> <p> </p><div class="tip" title="Tip" style="margin-left: 0.5in; margin-right: 0.5in;"><h3 class="title">Tip</h3> <p>Remember that the method <code class="code">Graph::SetBackgroundImageMix($aMix)</code> can be used to adjust the alpha blending of the background image</p> </div><p> </p> </div> <div class="sect2" title="Adjusting the interpretation for ordinal keys in data"><div class="titlepage"><div><div><h3 class="title"><a name="id2589846"></a>Adjusting the interpretation for ordinal keys in data</h3></div></div></div> <p>
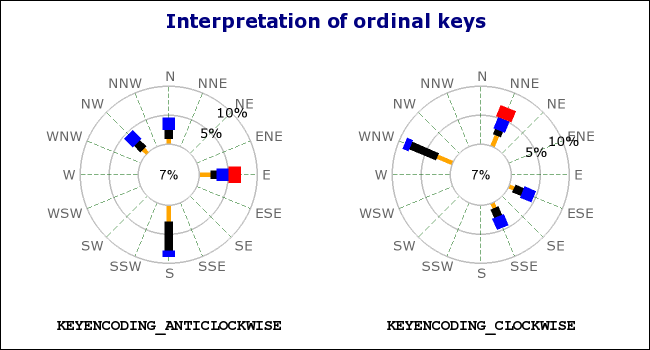
As previously stated the position for data values in the plot, (when the ' key is specified as an integer), is the index of the displayed axis counted counter-clockwise from "East". </p> <p>Another possibility which seems to be standard in some application of Windrose plots is to start counting clockwise from the first axis after the "North" axis. Depending on if the plots displays 16 , 8 or 3 axis this first axis (with ordinal number 0) would then be either "NNE", "NE" or "E".</p> <p>To adjust the interpretation the following method is used </p> <p> </p><div class="itemizedlist"><ul class="itemizedlist" type="disc"><li class="listitem"> <p><code class="code">WindrosePlot::SetDataKeyEncoding($aEncoding)</code> </p> <p>Possible values for the parameter are</p> <p> </p><div class="itemizedlist"><ul class="itemizedlist" type="circle"><li class="listitem"> <p><code class="code">KEYENCODING_CLOCKWISE</code>, This setting will force the plot to interpret the key in the data as counted clockwise. The axis with 0-index is taken to be the first existing axis just to the right of "North" counted clockwise.</p> </li><li class="listitem"> <p><code class="code">KEYENCODING_ANTICLOCKWISE</code>, This setting will force the plot to interpret the key in the data as counted counter-clockwise. The axis with the 0-index is the "East" axis.</p> </li></ul></div><p> </p> </li></ul></div><p> </p> <p>By default the setting is <code class="code">KEYENCODING_ANTICLOCKWISE</code>. ?? illustrates how the same data can be interpretated in two different way depending on this setting. The data in both figure a) and b) was given by the array </p> <p> </p><div class="hl-main"><table class="hl-table" width="100%"><tr><td class="hl-gutter" align="right" valign="top"><pre>1 2 3 4 5 6 </pre></td><td class="hl-main" valign="top"><pre><span class="hl-code">$data = array( 0 => array(3,2,1,2,2), 4 => array(1,1,1.5,2), 6 => array(1,1,1.5,2), 12 => array(2,3,5,1), );</span></pre></td></tr></table></div><p> </p> <p> </p><div class="figure"><a name="fig.windrose_ex9.1"></a><p class="title"><b>Figure 21.15. Interpretation of ordinal keys <code class="uri"><a class="uri" href="example_src/windrose_ex9.1.html" target="_top">(<code class="filename">windrose_ex9.1.php</code>)</a></code> </b></p><div class="figure-contents"> <span class="inlinemediaobject"><img src="images/windrose_ex9.1.png" alt="Interpretation of ordinal keys (windrose_ex9.1.php)"></span> </div></div><p><br class="figure-break"> </p> </div> </div><div class="navfooter"><hr><table width="100%" summary="Navigation footer"><tr><td width="40%" align="left"> </td><td width="20%" align="center"><a accesskey="u" href="ch21.html">Up</a></td><td width="40%" align="right"> </td></tr><tr><td width="40%" align="left" valign="top"> </td><td width="20%" align="center"><a accesskey="h" href="index.html">Home</a></td><td width="40%" align="right" valign="top"> </td></tr></table></div></body></html>