There are at least two reasons why one or several graphs should be combined into the same image.
-
To be able to create overall graphs that are strongly connected and cannot be separated
-
To reduce the download time by only have to download one image for several graphs
-
By convention, some types of graphs are always combined
The library provides a convenience class , class MGraph
(for Multi Graph) that assists with this. In order to use this class the module file
"jpgraph_mgraph.php" must be included.
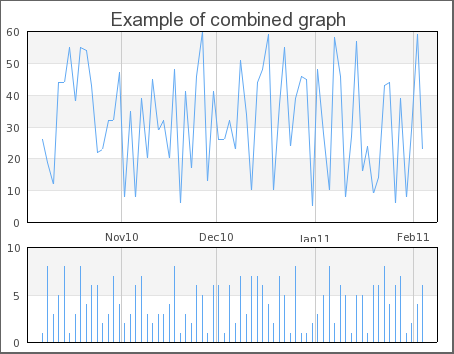
Figure 15.88. A combination of a line graph at top and a bar graph in the bottom ( shows an example of how this can be
used.combgraphex1.php)
In order to better understand what is involved in creating a combined graph we will first show how this is done manually.
This is done by creating some PHP/GD code that creates a big enough empty
image with plain GD commands and then get the image handles from the graphs that
should be combined. The image handel can be returned from the
Graph::Stroke() methods in the graphs that should be included.
It is then possible to use these handles together with the GD image copy command
and copy the individual graph images onto the previously created empty large GD
image.
The following (almost complete) code shows how this can be done
1 2 3 4 5 6 7 8 9 10 11 12 13 14 15 16 17 18 19 20 21 22 23 24 25 26 27 28 | // Assume we would like to combine graph1,2 and 3 // ...... create graph 1 here....... $handle1 = $graph1->Stroke( _IMG_HANDLER); // ...... create graph 2 here....... $handle2 = $graph2->Stroke( _IMG_HANDLER); // ...... create graph 3 here....... $handle3 = $graph3->Stroke( _IMG_HANDLER); // Now create the "melting graph" which should contain all three graphs // $WIDTH1 and $HEIGHT1 are width and height of graph 1 ($handle1) // $WIDTH2 and $HEIGHT2 are width and height of graph 2 ($handle2) // $WIDTH3 and $HEIGHT3 are width and height of graph 3 ($handle3) // $x2,$x3 and $y2,$y3 shift from top left of global graph (ie position of // graph2 and graph3 in global graph) $image = imagecreatetruecolor($WIDTH1,$HEIGHT1); imagecopy($image, $handle1,0, 0, 0, 0, $WIDTH1,$HEIGHT1); imagecopy($image, $handle2,$x1,$y1,0,0,$WIDTH2,$HEIGHT2); imagecopy($image, $handle3,$x2,$y2,0,0,$WIDTH3,$HEIGHT3); // Stream the result back as a PNG image header("Content-type: image/png"); imagepng ($image); |
The advantages with this fully manual method are
-
Absolute full control on a pixel level how the graphs are combined
-
Full transparency on how the combination is done
but on the other hand the disadvantages are
-
Requires knowledge of the GD library
-
Requires re-inventing the wheel (since a lot of functionality to manipulate the GD library is already available in the JpGraph library)
It is here the class MGraph comes in. It will allow you to very
easily create a combination of several graphs without knowing all the details on
the GD library or calculating pixel positions.
This helper class abstracts away all the details about copying images as well as offering consistent interface (almost identical with the standard Graph class). A basic example will quickly reveal the elegance of using this helper class.
1 2 3 4 5 6 7 8 9 10 11 12 13 14 15 16 17 18 19 20 21 22 23 24 25 | //-------------------------------------- // Graph 1 //-------------------------------------- $graph1 = new Graph(...); //... [Code to create graph1] ... //-------------------------------------- // Graph 2 //-------------------------------------- $graph2 = new Graph(...); //... [Code to create graph2] ... //-------------------------------------- // Create a combined graph //-------------------------------------- $mgraph = new MGraph(); $xpos1=3;$ypos1=3; $xpos2=3;$ypos2=200; $mgraph->Add($graph1,$xpos1,$ypos1); $mgraph->Add($graph2,$xpos2,$ypos2); $mgraph->Stroke(); |
The above example illustrates the most basic usage of the MGraph
class.
Each graph is added to the combined graph with a call to
MGraph::Add() which in addition to the graph argument also
takes the target X and Y coordinates where the graph will be placed in the
combined image. The target X and Y coordinates are relative to any optional
specified left and top margin.
In addition to adding graphs there are some basic formatting option for the
combined graph that are listed below. The core methods provided by the
MGraph class are
-
MGraph::MGraph($aWidth,$aHeight).Create a new instance of the
MGraphclass. If the width and height are supplied as arguments they will override the automatically determined width and height. -
MGraph::Add($aGraph,$aToX,$aToY,$aFromX,$aFromY,$aWidth,$aHeight).Add a new subgraph with destination position (
$aToX,$aToY). By default the whole graph image is used. It is also possible to only specify that part of the graph should be used. The source rectangle is specified by($aFromX, $aFromY, $aWidth, $aHeight). -
MGraph::SetFillColor($aColor).Background color of the combined graphs.
Example: Setting an Orange background
1
$mgraph->SetFillColor('orange'); -
MGraph::SetFrame($aShow,$aColor,$aWeight)Adding a frame to the combined graph.
Example: To add a blue frame with a 2 pixel width
1
$mgraph->SetFrame(true,'blue ',2); -
MGraph::SetMargin($aLeft,$aRight,$aTop,$aBottom)Adding a margin to the image. By default the minimum necessary size for the combined graph to hold all the added subgraphs is used. Use this method to add some space to the edges around the combined image. When the individual graphs are positioned (in the
Add()method) the position is counted relative to the left and top margin.Example: Use 10 pixel left and right margin, 5 pixel top and bottom margin
1
$mgraph->SetMargin(10,10,5,5); -
MGraph::SetShadow($aShowShadow=true,$aShadowWidth=4,$aShadowColor='gray@0.3')This adds a drop shadow to the MGraph in the same way as for the usual graph class
In the same way as the ordinary Graph class the MGraph class also
have a property $footer which allows the setting of a left, center and right
footer (see Adding a footer to the graph).
In addition the MGraph::Stroke() accepts a filename in the same
way as the normal Graph::Stroke()
In addition to the basic usage as shown above it is also possible to add a background image in the combined graph. What is important to remember then is that all the subgraphs are copied onto the combined graph so normally they will be on top of the background image and hide it.
There are two ways of handling a background image
-
Do nothing and the background image will only "shine through" for those areas of the combined graph that is not covered by any subgraph.
-
Specify a "blend" factor for the subgraphs that specifies how much of the background image will be mixed with the subgraph. The blend factor is as usual specified as an integer in the interval 0-100. (Note: This is the same functionality as the standard
Graph::SetBackgroundImageMix()for ordinary graphs.) A value of 0 means that 100% of the background is visible and a value of 100 means that 0% of the background is visible.To add a subgraphs with a blend factor the method
MGrahp::AddMix()is used. This behaves exactly as the standardMGraph::Add()apart from the fact that the 3:rd argument is the blend factor (after the two x and y coordinates).Example: Add a graph with 50% mix of the background
1
$mgraph->AddMix($graph,0,0,50);
The background image itself is added with the method
-
MGraph::SetBackgroundImage($aFile,$aCenter_aX=TRUE,$aY=NULL)
The filename specifies the full name of the background image (including extension). Please note that the extension must be a valid image extension in order for the library to determine the format of the image file.
The second argument can be either numeric or a boolean in which case it specifies if the background image should be centered or if it should just be copied from the top left position. If it is numerical it is interpretated as the X-position for the optional X and Y coordinates specifying the position of the top left corner of the background image.
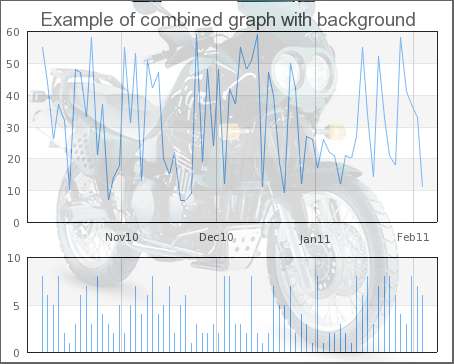
Figure 15.89. Mixing a background image with two subgraphs. In this case the mixing factor was 85 for both subgraphs. (Note: To reduce load time the image is quite hard compressed in JPEG so there are some artifacts in high-frequency areas.) ( shows a variant of Figure 15.88. A combination of a line graph at top and a bar graph in the bottom combgraphex2.php)( where a centered background image is mixed
in with two subgraphs. combgraphex1.php)
Figure 15.89. Mixing a background image with two subgraphs. In this case the mixing factor was 85 for both subgraphs. (Note: To reduce load time the image is quite hard compressed in JPEG so there are some artifacts in high-frequency areas.) ( combgraphex2.php)
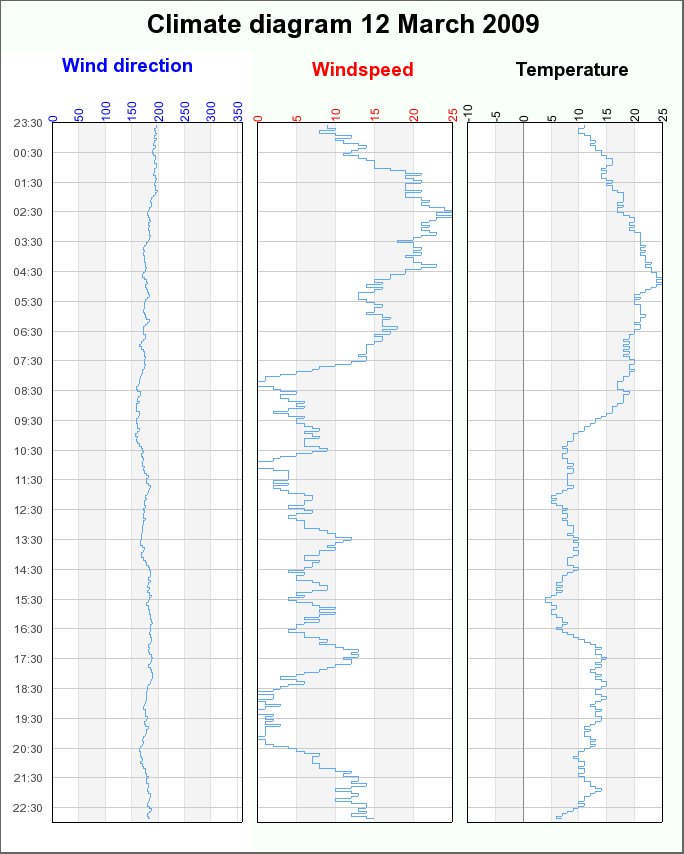
There are in principle no difference when combing graphs top/bottom or left/right. ?? shows an example of creating a graph that illustrates the changing weather conditions measure by Wind direction, speed and temperature in one graph with a detailed vertical scale showing the time.
Since this follows exactly the same principle laid out above the script should be fairly self explanatory. Note that we have suppressed the x-scale on two of the graphs to make better use of the available image size and also to create a stronger sense of "belonging" between the individual graphs.
There are some drawbacks using combined graphs
-
CSIM Image maps can not be used with combined graphs.
-
Creating multiple graphs in the same script will require some additional memory. Make sure that the memory limit in "
php.ini" is sufficient. -
Adding background images can significantly increase the final size of the image. Using the JPEG image format when photo like background images are used gives better compressing than PNG (since JPEG is a lossy format). For example setting the JPEG quality parameter to 60 (default is 75).
1
$mgraph->SetImgFormat('jpeg',60);Tip
This setting can be used for ordinary Graphs as well.
-
Compared with background images for ordinary graphs there is currently no possibility for automatic re-sizing of the background images.