<html><head><meta http-equiv="Content-Type" content="text/html; charset=UTF-8"><title>Adding icons (and small images) to the graph</title><link rel="stylesheet" type="text/css" href="manual.css"><meta name="generator" content="DocBook XSL Stylesheets V1.76.0"><link rel="home" href="index.html" title="JpGraph Manual"><link rel="up" href="ch14.html" title="Chapter 14. Common features for all Cartesian (x,y) graph types"></head><body bgcolor="white" text="black" link="#0000FF" vlink="#840084" alink="#0000FF"><div class="navheader"><table width="100%" summary="Navigation header"><tr><th colspan="3" align="center">Adding icons (and small images) to the graph</th></tr><tr><td width="20%" align="left"> </td><th width="60%" align="center">Chapter 14. Common features for all Cartesian (x,y) graph types</th><td width="20%" align="right"> </td></tr></table><hr></div><div class="sect1" title="Adding icons (and small images) to the graph"><div class="titlepage"><div><div><h2 class="title" style="clear: both"><a name="sec.adding-icons-to-graph"></a>Adding icons (and small images) to the graph</h2></div></div></div> <p>In addition to the standard background image you can also add an arbitrary number of icons onto the background of the graph. These icons are created with a call to the special Plot <code class="code">class IconPlot</code> defined in the module "<code class="filename">jpgraph_iconplot.php</code>". The image which is the base of the icons can be </p> <p> </p><div class="orderedlist"><ol class="orderedlist" type="1"><li class="listitem"> <p>an arbitrary image from a file</p> </li><li class="listitem"> <p>one of the built-in country flags</p> </li></ol></div><p> </p> <p>The basic structure of adding an icon somewhere on the graph is to first create an instance of the IconPlot class and then position the icon at the wanted x,y-position on the graph and finally add the object to the graph using the standard <code class="code">Graph::Add()</code> method. The constructor for the IconPlot class have the following signature</p> <p> </p><div class="itemizedlist"><ul class="itemizedlist" type="disc"><li class="listitem"> <p><code class="code">__construct($aFile='',$aX=0,$aY=0,$aScale=1.0,$aMix=100)</code></p> <p>The parameters should be self explanatory. The <code class="code">$aMix</code> factor specifies the degree of alpha blending between the background and the icon. A value of 100 means no blending and a value of 0 means that the icon is not shown at all, only the background.</p> </li></ul></div><p> </p> <p>Some useful methods in this class are</p> <p> </p><div class="itemizedlist"><ul class="itemizedlist" type="disc"><li class="listitem"> <p><code class="code">SetCountryFlag($aFlag,$aX=0,$aY=0,$aScale=1.0,$aMix=100,$aStdSize=3)</code></p> <p>This method specifies that the specified country flag should be used</p> </li><li class="listitem"> <p><code class="code">SetPos($aX,$aY)</code></p> <p>Same as the optional arguments in th constructor. The coordinates are specified as absolute pixels where (0,0) is the top left corner.</p> </li><li class="listitem"> <p><code class="code">CreateFromString($aStr)</code></p> <p>Creates the image from a string instead of reading it from a file. </p> </li><li class="listitem"> <p><code class="code">SetScalePos($aX,$aY)</code></p> <p>Specifes the potision using the scale coordinate as specified by the x- and y-scales</p> </li><li class="listitem"> <p><code class="code">SetAnchor($aXAnchor='left',$aYAnchor='center')</code></p> <p>Sets the anchor point of the icon, i.e. the position in the icon that should be aligned with the specified icon position in the graph.</p> </li></ul></div><p> </p> <p>The following short example shows how an icon is created and added to a graph</p> <p> </p><div class="hl-main"><table class="hl-table" width="100%"><tr><td class="hl-gutter" align="right" valign="top"><pre>1 2 3 </pre></td><td class="hl-main" valign="top"><pre><span class="hl-code">$icon = new IconPlot('myimage.png',0.2,0.3,1,30); $icon->SetAnchor('center','center'); $graph->Add($icon);</span></pre></td></tr></table></div><p> </p> <p>It is possible to control how much of the icon should be blended into the background by specifying a percentage (1-100). The example below in <a class="xref" href="ch14s14.html#fig.lineiconex1" title="Figure 14.84. Mixing an icon image into the background of the graph. The area plot in the graph uses alpha blending to achieve see-through affect (lineiconex1.php)">Figure 14.84. Mixing an icon image into the background of the graph. The area plot in the graph uses alpha blending to achieve see-through affect <code class="uri"><a class="uri" href="example_src/lineiconex1.html" target="_top">(<code class="filename">lineiconex1.php</code>)</a></code> </a> shows how to mix in the picture of "Tux the penguin" into the background of a filled line graph. </p> <p> </p><div class="figure"><a name="fig.lineiconex1"></a><p class="title"><b>Figure 14.84. Mixing an icon image into the background of the graph. The area plot in the graph uses alpha blending to achieve see-through affect <code class="uri"><a class="uri" href="example_src/lineiconex1.html" target="_top">(<code class="filename">lineiconex1.php</code>)</a></code> </b></p><div class="figure-contents"> <span class="inlinemediaobject"><img src="images/lineiconex1.png" alt="Mixing an icon image into the background of the graph. The area plot in the graph uses alpha blending to achieve see-through affect (lineiconex1.php)"></span> </div></div><p><br class="figure-break"> </p> <p>
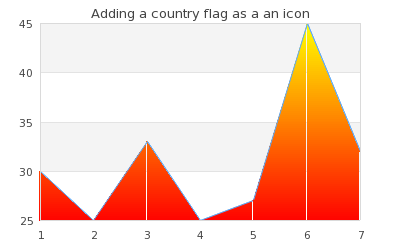
To specify any of the roughly 200 country flags as an icon the first step is to create an empty Icon and then call the <code class="code">IconPlot::SetCountryFlag()</code> method with the appropriate parameters. This is illustrated below by adding the Icelandic flag into the background as an icon.</p> <p> </p><div class="figure"><a name="fig.lineiconex2"></a><p class="title"><b>Figure 14.85. Adding a country flag icon in the background <code class="uri"><a class="uri" href="example_src/lineiconex2.html" target="_top">(<code class="filename">lineiconex2.php</code>)</a></code> </b></p><div class="figure-contents"> <span class="inlinemediaobject"><img src="images/lineiconex2.png" alt="Adding a country flag icon in the background (lineiconex2.php)"></span> </div></div><p><br class="figure-break"> </p> <p> </p><div class="caution" title="Caution" style="margin-left: 0.5in; margin-right: 0.5in;"><h3 class="title">Caution</h3> <p>Some older versions of PHP (< 4.3.3 using the built-in GD) have problems rendering blended images. If you have this problem then you need to upgrade to a more recent version of PHP.</p> </div><p> </p> </div><div class="navfooter"><hr><table width="100%" summary="Navigation footer"><tr><td width="40%" align="left"> </td><td width="20%" align="center"><a accesskey="u" href="ch14.html">Up</a></td><td width="40%" align="right"> </td></tr><tr><td width="40%" align="left" valign="top"> </td><td width="20%" align="center"><a accesskey="h" href="index.html">Home</a></td><td width="40%" align="right" valign="top"> </td></tr></table></div></body></html>