<html><head><meta http-equiv="Content-Type" content="text/html; charset=UTF-8"><title>Polar graphs</title><link rel="stylesheet" type="text/css" href="manual.css"><meta name="generator" content="DocBook XSL Stylesheets V1.76.0"><link rel="home" href="index.html" title="JpGraph Manual"><link rel="up" href="ch16.html" title="Chapter 16. Non-Linear graph types"></head><body bgcolor="white" text="black" link="#0000FF" vlink="#840084" alink="#0000FF"><div class="navheader"><table width="100%" summary="Navigation header"><tr><th colspan="3" align="center">Polar graphs</th></tr><tr><td width="20%" align="left"> </td><th width="60%" align="center">Chapter 16. Non-Linear graph types</th><td width="20%" align="right"> </td></tr></table><hr></div><div class="sect1" title="Polar graphs"><div class="titlepage"><div><div><h2 class="title" style="clear: both"><a name="sec.polar-graphs"></a>Polar graphs</h2></div></div></div> <p>In order to create Radar graphs the module "<code class="filename">jpgraph_polar.php</code>" must first be included.</p> <p>Each data point in a polar plot is represented by a tuple consisting of a radius and an angle. The polar plot itself can be either outlined or filled. In addition each point may have a standard marker (the same as for line and scatter plots). </p> <p>The scale for the radius can be either linear or logarithmic.</p> <p>A polar graph is created by creating an instance of <code class="code">class PolarGraph</code>. The polar graph type inherits all the capabilities of ordinary x,y graphs, i.e they can have background images, background gradients, formatted titles, using tabbed titles etc.</p> <p>There are two types of polar graphs, full 360 degree view or just 180 degree view. The figures below show the difference between these two graph types.</p> <p> </p><div class="informaltable"> <table border="0"><colgroup><col class="c1"><col class="c2"></colgroup><tbody><tr><td> <div class="figure"><a name="fig.polarex0"></a><p class="title"><b>Figure 16.42. A full 360 degree polar graph <code class="uri"><a class="uri" href="example_src/polarex0.html" target="_top">(<code class="filename">polarex0.php</code>)</a></code> </b></p><div class="figure-contents"> <span class="inlinemediaobject"><img src="images/polarex0.png" alt="A full 360 degree polar graph (polarex0.php)"></span> </div></div><br class="figure-break"> </td><td> <div class="figure"><a name="fig.polarex0-180"></a><p class="title"><b>Figure 16.43. A 180 degree (half) polar graph <code class="uri"><a class="uri" href="example_src/polarex0-180.html" target="_top">(<code class="filename">polarex0-180.php</code>)</a></code> </b></p><div class="figure-contents"> <span class="inlinemediaobject"><img src="images/polarex0-180.png" alt="A 180 degree (half) polar graph (polarex0-180.php)"></span> </div></div><br class="figure-break"> </td></tr></tbody></table> </div><p> </p> <p>
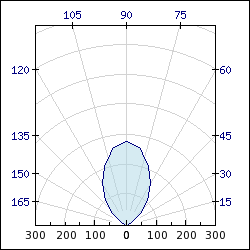
The choice is controlled with the method</p> <p> </p><div class="itemizedlist"><ul class="itemizedlist" type="disc"><li class="listitem"> <p><code class="code">PolarGraph::SetType($aType)</code></p> <p><code class="code">$aType</code> is specified with the symbolic defines</p> <p> </p><div class="itemizedlist"><ul class="itemizedlist" type="circle"><li class="listitem"> <p><code class="code">POLAR_360</code>, The default</p> </li><li class="listitem"> <p><code class="code">POLAR_180</code></p> </li></ul></div><p> </p> </li></ul></div><p> </p> <p>
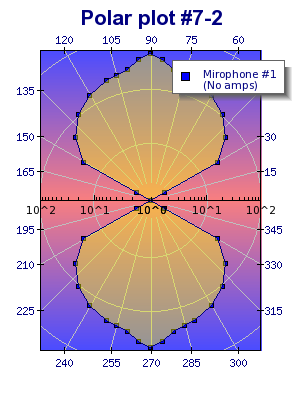
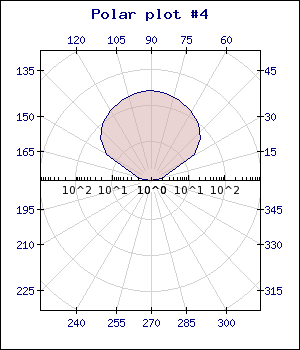
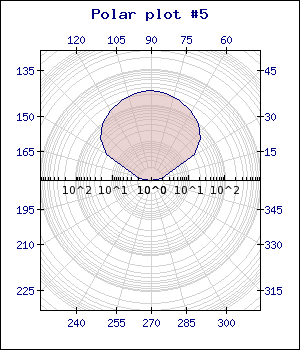
As an example of using some more of the available formatting that is discussed in later sections <a class="xref" href="ch16s03.html#fig.polarex7-2" title="Figure 16.44. A 360 polar plot with background gradient and alpha blending (polarex7-2.php)">Figure 16.44. A 360 polar plot with background gradient and alpha blending <code class="uri"><a class="uri" href="example_src/polarex7-2.html" target="_top">(<code class="filename">polarex7-2.php</code>)</a></code> </a> shown a full 360 degree plot with both background gradient as well as using alpha blending for the fill of the polar plot.</p> <p> </p><div class="figure"><a name="fig.polarex7-2"></a><p class="title"><b>Figure 16.44. A 360 polar plot with background gradient and alpha blending <code class="uri"><a class="uri" href="example_src/polarex7-2.html" target="_top">(<code class="filename">polarex7-2.php</code>)</a></code> </b></p><div class="figure-contents"> <span class="inlinemediaobject"><img src="images/polarex7-2.png" alt="A 360 polar plot with background gradient and alpha blending (polarex7-2.php)"></span> </div></div><p><br class="figure-break"> </p> <p></p> <div class="sect2" title="Rotating the polar graph"><div class="titlepage"><div><div><h3 class="title"><a name="id2568891"></a>Rotating the polar graph</h3></div></div></div> <p> </p><div class="caution" title="Caution" style="margin-left: 0.5in; margin-right: 0.5in;"><h3 class="title">Caution</h3> <p>There is a bug in versions before v3.0.4 so that a rotated polar graph must always have equal margins on all side to work as expected.</p> </div><p> </p> <p>
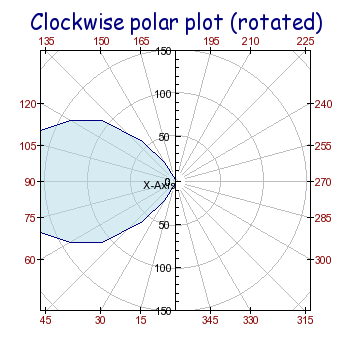
By default the start angle (angle=0) is located at the 3'a clock position. By calling the method <code class="code">Graph::Set90AndMargin()</code> it is possible to rotate the graph so that the 0-angle position is at the 6'a clock position (straight down). This is mostly used for full 360 degree graphs.</p> </div> <div class="sect2" title="Changing the angle direction"><div class="titlepage"><div><div><h3 class="title"><a name="id2568920"></a>Changing the angle direction</h3></div></div></div> <p> </p><div class="note" title="Note" style="margin-left: 0.5in; margin-right: 0.5in;"><h3 class="title">Note</h3> <p>This is only available in v3.0.4 of the library and above.</p> </div><p> </p> <p>
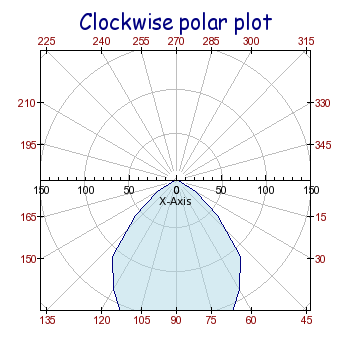
By default the angle is counted counter-clockwise as is custom in most application of polar plots. However, it is also possible to have the angles counted clockwise. This is done by calling the method <code class="code">Graph::SetClockwise()</code>. </p> <p>In the following two examples we show a full 360 degree polar plots with clockwise ordering in both a standard configuration and also as a 90 degrees rotated graph.</p> <p> <table xmlns="" frame="void" id="id2568955"> <tbody xmlns=""> <tr> <td> <div class="figure"><a name="fig.polarclockex1"></a><p class="title"><b>Figure 16.45. Clockwise polar graph <code class="uri"><a class="uri" href="example_src/polarclockex1.html" target="_top">(<code class="filename">polarclockex1.php</code>)</a></code> </b></p><div class="figure-contents"> <span class="inlinemediaobject"><img src="images/polarclockex1.png" alt="Clockwise polar graph (polarclockex1.php)"></span> </div></div><br class="figure-break"> </td> <td> <div class="figure"><a name="fig.polarclockex2"></a><p class="title"><b>Figure 16.46. Rotated clockwise polar graph <code class="uri"><a class="uri" href="example_src/polarclockex2.html" target="_top">(<code class="filename">polarclockex2.php</code>)</a></code> </b></p><div class="figure-contents"> <span class="inlinemediaobject"><img src="images/polarclockex2.png" alt="Rotated clockwise polar graph (polarclockex2.php)"></span> </div></div><br class="figure-break"> </td> </tr> </tbody> </table> </p> </div> <div class="sect2" title="Adding polar plots to a polar graph"><div class="titlepage"><div><div><h3 class="title"><a name="id2569025"></a>Adding polar plots to a polar graph</h3></div></div></div> <p>The principle is exactly the same as for line plots but instead of an x-y coordinate each point is represented by a angle and a radius to specify its position. The data is given in the format</p> <p> </p><div class="hl-main"><table class="hl-table" width="100%"><tr><td class="hl-gutter" align="right" valign="top"><pre>1 </pre></td><td class="hl-main" valign="top"><pre><span class="hl-code">$data = array(angle1, radius1, angle2, radius2, ...)</span></pre></td></tr></table></div><p> </p> <p>Creation of a single polar plot follows the now familiar structure as shown in the following code snippet</p> <p> </p><div class="hl-main"><table class="hl-table" width="100%"><tr><td class="hl-gutter" align="right" valign="top"><pre>1 2 3 4 5 6 7 8 9 10 11 12 13 14 15 16 17 18 19 </pre></td><td class="hl-main" valign="top"><pre><span class="hl-inlinetags"><?php</span><span class="hl-code"> ... </span><span class="hl-comment">//</span><span class="hl-comment"> Setup the graph</span><span class="hl-comment"></span><span class="hl-code"> </span><span class="hl-var">$graph</span><span class="hl-code"> = </span><span class="hl-reserved">new</span><span class="hl-code"> </span><span class="hl-identifier">PolarGraph</span><span class="hl-brackets">(</span><span class="hl-var">$width</span><span class="hl-code">,</span><span class="hl-var">$height</span><span class="hl-brackets">)</span><span class="hl-code">; </span><span class="hl-comment">//</span><span class="hl-comment"> Set a logarithmic scale with 100 as the maximum value, i.e. 10^2</span><span class="hl-comment"></span><span class="hl-code"> </span><span class="hl-var">$graph</span><span class="hl-code">-></span><span class="hl-identifier">SetScale</span><span class="hl-brackets">(</span><span class="hl-quotes">'</span><span class="hl-string">log</span><span class="hl-quotes">'</span><span class="hl-code">,</span><span class="hl-number">100</span><span class="hl-brackets">)</span><span class="hl-code">; </span><span class="hl-comment">//</span><span class="hl-comment"> Use a full 360 degree polar graph</span><span class="hl-comment"></span><span class="hl-code"> </span><span class="hl-var">$graph</span><span class="hl-code">-></span><span class="hl-identifier">SetType</span><span class="hl-brackets">(</span><span class="hl-identifier">POLAR_360</span><span class="hl-brackets">)</span><span class="hl-code">; </span><span class="hl-comment">//</span><span class="hl-comment"> Create a plot with marks</span><span class="hl-comment"></span><span class="hl-code"> </span><span class="hl-var">$polarplot</span><span class="hl-code"> = </span><span class="hl-reserved">new</span><span class="hl-code"> </span><span class="hl-identifier">PolarPlot</span><span class="hl-brackets">(</span><span class="hl-var">$data</span><span class="hl-brackets">)</span><span class="hl-code">; </span><span class="hl-var">$polarplot</span><span class="hl-code">-></span><span class="hl-identifier">mark</span><span class="hl-code">-></span><span class="hl-identifier">SetType</span><span class="hl-brackets">(</span><span class="hl-identifier">MARK_SQUARE</span><span class="hl-brackets">)</span><span class="hl-code">; </span><span class="hl-comment">//</span><span class="hl-comment"> Add it to the graph</span><span class="hl-comment"></span><span class="hl-code"> </span><span class="hl-var">$graph</span><span class="hl-code">-></span><span class="hl-identifier">Add</span><span class="hl-brackets">(</span><span class="hl-var">$polarplot</span><span class="hl-brackets">)</span><span class="hl-code">; ... </span><span class="hl-inlinetags">?></span></pre></td></tr></table></div><p> </p> <p>Adding multiple polar plots follows the same pattern. Each polar plot is created as an instance of <code class="code">class PolarPlot</code> and then added to the graph.</p> </div> <div class="sect2" title="Adding plot-marks to polar plots"><div class="titlepage"><div><div><h3 class="title"><a name="id2569090"></a>Adding plot-marks to polar plots</h3></div></div></div> <p>
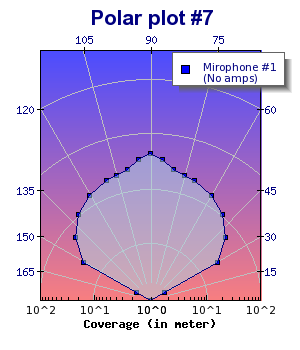
In exactly the same way as for line graphs it is possible to add plot marks in radar plots. The mark property is accessed through the instance variable</p> <p> </p><div class="itemizedlist"><ul class="itemizedlist" type="disc"><li class="listitem"> <p><code class="code">PolarPlot::mark </code></p> </li></ul></div><p> </p> <p>(All available plot marks are listed in <a class="xref" href="ape.html" title="Appendix E. Available plot marks">Appendix E. <i>Available plot marks</i></a>)</p> <p>For example to add a square marker (with the default color) the following line must be added</p> <p> </p><div class="hl-main"><table class="hl-table" width="100%"><tr><td class="hl-gutter" align="right" valign="top"><pre>1 </pre></td><td class="hl-main" valign="top"><pre><span class="hl-code">$polarplot->mark->SetType(MARK_SQUARE);</span></pre></td></tr></table></div><p> </p> <p>In <a class="xref" href="ch16s03.html#fig.polarex7-1" title="Figure 16.47. Adding plot marks to a polar graph (polarex7-1.php)">Figure 16.47. Adding plot marks to a polar graph <code class="uri"><a class="uri" href="example_src/polarex7-1.html" target="_top">(<code class="filename">polarex7-1.php</code>)</a></code> </a> we show a polar graph with added plot-marks. In addition we have added a gradient background.</p> <p> </p><div class="figure"><a name="fig.polarex7-1"></a><p class="title"><b>Figure 16.47. Adding plot marks to a polar graph <code class="uri"><a class="uri" href="example_src/polarex7-1.html" target="_top">(<code class="filename">polarex7-1.php</code>)</a></code> </b></p><div class="figure-contents"> <span class="inlinemediaobject"><img src="images/polarex7-1.png" alt="Adding plot marks to a polar graph (polarex7-1.php)"></span> </div></div><p><br class="figure-break"> </p> </div> <div class="sect2" title="Client Side Image maps"><div class="titlepage"><div><div><h3 class="title"><a name="id2569156"></a>Client Side Image maps</h3></div></div></div> <p>(See <a class="xref" href="ch10.html" title="Chapter 10. Using CSIM (Client side image maps)">Chapter 10. <i>Using CSIM (Client side image maps)</i></a> for a full description on the usage of CSIM together with the library)</p> <p>If markers are shown for the polar plot (by setting the mark property of the plot) each marker can be a hot spot in a client side image map. The target URL are as usual specified with the<code class="code"> SetCSIMTargets()</code> as the following short code snippet shows</p> <p> </p><div class="hl-main"><table class="hl-table" width="100%"><tr><td class="hl-gutter" align="right" valign="top"><pre>1 2 3 4 5 6 7 8 9 </pre></td><td class="hl-main" valign="top"><pre><span class="hl-inlinetags"><?php</span><span class="hl-code"> </span><span class="hl-comment">//</span><span class="hl-comment"> Start by specifying the proper URL targets</span><span class="hl-comment"></span><span class="hl-code"> </span><span class="hl-var">$targets</span><span class="hl-code"> = </span><span class="hl-reserved">array</span><span class="hl-brackets">(</span><span class="hl-code"> </span><span class="hl-quotes">"</span><span class="hl-string">#1</span><span class="hl-quotes">"</span><span class="hl-code"> , </span><span class="hl-quotes">"</span><span class="hl-string">#2</span><span class="hl-quotes">"</span><span class="hl-code"> , ....... </span><span class="hl-brackets">)</span><span class="hl-code">; </span><span class="hl-var">$polarplot</span><span class="hl-code"> = </span><span class="hl-reserved">new</span><span class="hl-code"> </span><span class="hl-identifier">PolarPlot</span><span class="hl-brackets">(</span><span class="hl-code"> </span><span class="hl-var">$data</span><span class="hl-code"> </span><span class="hl-brackets">)</span><span class="hl-code">; </span><span class="hl-var">$polarplot</span><span class="hl-code">-></span><span class="hl-identifier">mark</span><span class="hl-code">-></span><span class="hl-identifier">SetType</span><span class="hl-brackets">(</span><span class="hl-code"> </span><span class="hl-identifier">MARK_SQUARE</span><span class="hl-code"> </span><span class="hl-brackets">)</span><span class="hl-code">; </span><span class="hl-var">$polarplot</span><span class="hl-code">-></span><span class="hl-identifier">SetCSIMTargets</span><span class="hl-brackets">(</span><span class="hl-code"> </span><span class="hl-identifier">targets</span><span class="hl-code"> </span><span class="hl-brackets">)</span><span class="hl-code">; </span><span class="hl-var">$graph</span><span class="hl-code">-></span><span class="hl-identifier">Add</span><span class="hl-brackets">(</span><span class="hl-code"> </span><span class="hl-var">$polarplot</span><span class="hl-code"> </span><span class="hl-brackets">)</span><span class="hl-code">; </span><span class="hl-var">$graph</span><span class="hl-code">-></span><span class="hl-identifier">StrokeCSIM</span><span class="hl-brackets">(</span><span class="hl-brackets">)</span><span class="hl-code">; </span><span class="hl-inlinetags">?></span></pre></td></tr></table></div><p> </p> </div> <div class="sect2" title="Adjusting the radius scale"><div class="titlepage"><div><div><h3 class="title"><a name="id2569166"></a>Adjusting the radius scale</h3></div></div></div> <p>The radius axis can be shown in either a linear or logarithmic scale. This is controlled by a call to </p> <p> </p><div class="itemizedlist"><ul class="itemizedlist" type="disc"><li class="listitem"> <p><code class="code">PolarGraph::SetScale($aScale,$aRadiusMax=0)</code></p> <p>Supported scale types for <code class="code">$aScale</code> are the strings "<code class="code">lin</code>" or "<code class="code">log</code>". The second argument is an optional manual setting of the maximum scale value for the radius.</p> </li></ul></div><p> </p> <p>The two examples below show the same plot in either linear or logarithmic scale for the radius</p> <p> </p><div class="informaltable"> <table border="0"><colgroup><col class="c1"><col class="c2"></colgroup><tbody><tr><td> <div class="figure"><a name="fig.polarex3-lin"></a><p class="title"><b>Figure 16.48. Linear scale for radius <code class="uri"><a class="uri" href="example_src/polarex3-lin.html" target="_top">(<code class="filename">polarex3-lin.php</code>)</a></code> </b></p><div class="figure-contents"> <span class="inlinemediaobject"><img src="images/polarex3-lin.png" alt="Linear scale for radius (polarex3-lin.php)"></span> </div></div><br class="figure-break"> </td><td> <div class="figure"><a name="fig.polarex3"></a><p class="title"><b>Figure 16.49. Logarithmic scale for radius <code class="uri"><a class="uri" href="example_src/polarex3.html" target="_top">(<code class="filename">polarex3.php</code>)</a></code> </b></p><div class="figure-contents"> <span class="inlinemediaobject"><img src="images/polarex3.png" alt="Logarithmic scale for radius (polarex3.php)"></span> </div></div><br class="figure-break"> </td></tr></tbody></table> </div><p> </p> <p>
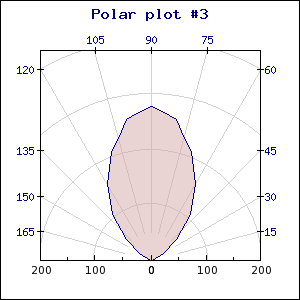
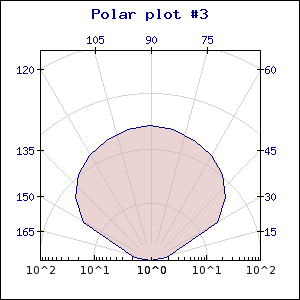
Please note that the maximum values of the scales are different.</p> <p>By default the scale will be auto scaled depending on the data. It is also possible to specify a manual scale by supplying an extra argument to the <code class="code">SetScale()</code> method. </p> <p>The only difference from the manual scaling with the standard x-y-graphs is that for polar graph only the maximum value is manually specified. The minimum will always be 0 for the linear scale and a scaled value of 10 (i.e 1, 0.1, 0.001 and so on) for the logarithmic scale.</p> <p> </p><div class="note" title="Note" style="margin-left: 0.5in; margin-right: 0.5in;"><h3 class="title">Note</h3> <p>The plot is always clipped to the plot area.</p> </div><p> </p> </div> <div class="sect2" title="Adjusting the grid lines"><div class="titlepage"><div><div><h3 class="title"><a name="id2569422"></a>Adjusting the grid lines</h3></div></div></div> <p>The graph allows several formatting option for the grid lines. For polar plots there are two types of grid lines, the angle and the radius grid lines.</p> <p>Grid lines format is controlled by</p> <p> </p><div class="itemizedlist"><ul class="itemizedlist" type="disc"><li class="listitem"> <p><code class="code">PolarAxis::ShowGrid($aMajor=true,$aMinor=false,$aAngle=true)</code></p> <p>Decide if the major,minor and angle grid line should be displayed </p> </li><li class="listitem"> <p><code class="code">PolarAxis::SetGridColor($aMajorColor,$aMinorColor='',$aAngleColor='')</code></p> <p>Specify the color for the major,minor and angel grid</p> </li><li class="listitem"> <p><code class="code">PolarAxis::SetAngleStep($aStep) </code></p> <p>This specifies the angle distance between two consecutive angel scale marks in degrees. By default the step size is 15 degrees.</p> </li></ul></div><p> </p> <p>The two example below shows a logarithmic plot with either just major grid lines or both minor and major grid lines.</p> <p> </p><div class="informaltable"> <table border="0"><colgroup><col class="c1"><col class="c2"></colgroup><tbody><tr><td> <div class="figure"><a name="fig.polarex4"></a><p class="title"><b>Figure 16.50. Logarithmic scale with only major grid lines <code class="uri"><a class="uri" href="example_src/polarex4.html" target="_top">(<code class="filename">polarex4.php</code>)</a></code> </b></p><div class="figure-contents"> <span class="inlinemediaobject"><img src="images/polarex4.png" alt="Logarithmic scale with only major grid lines (polarex4.php)"></span> </div></div><br class="figure-break"> </td><td> <div class="figure"><a name="fig.polarex5"></a><p class="title"><b>Figure 16.51. Logarithmic scale with both major and minor grid lines <code class="uri"><a class="uri" href="example_src/polarex5.html" target="_top">(<code class="filename">polarex5.php</code>)</a></code> </b></p><div class="figure-contents"> <span class="inlinemediaobject"><img src="images/polarex5.png" alt="Logarithmic scale with both major and minor grid lines (polarex5.php)"></span> </div></div><br class="figure-break"> </td></tr></tbody></table> </div><p> </p> </div> <div class="sect2" title="Adjusting the labels"><div class="titlepage"><div><div><h3 class="title"><a name="id2569493"></a>Adjusting the labels</h3></div></div></div> <p>It is possible to individually specify different fonts and colors for the angle and the radius labels. </p> <p> </p><div class="itemizedlist"><ul class="itemizedlist" type="disc"><li class="listitem"> <p><code class="code">PolarAxis::SetFont()</code> </p> <p>Adjust the radius font</p> </li><li class="listitem"> <p><code class="code">PolarAxis::SetAngleFont()</code></p> <p>Adjust the radius font</p> </li><li class="listitem"> <p><code class="code">PolarAxis::SetColor()</code></p> <p>Adjust the radius color</p> </li></ul></div><p> </p> <p>
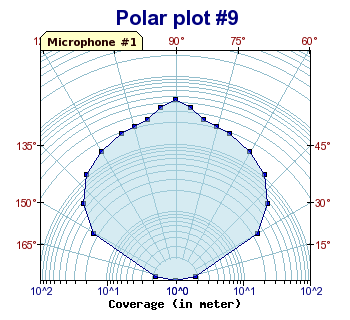
The following example specifies different color for the labels. it also shows how to add both a radial axis title as well as a tabbed title. In this example we have also chosen not to show the frame around the edge of the plot.</p> <p> </p><div class="figure"><a name="fig.polarex9"></a><p class="title"><b>Figure 16.52. Different colors for labels, specifying both a tabbed title as well as a axis title <code class="uri"><a class="uri" href="example_src/polarex9.html" target="_top">(<code class="filename">polarex9.php</code>)</a></code> </b></p><div class="figure-contents"> <span class="inlinemediaobject"><img src="images/polarex9.png" alt="Different colors for labels, specifying both a tabbed title as well as a axis title (polarex9.php)"></span> </div></div><p><br class="figure-break"> </p> <p> </p><div class="note" title="Note" style="margin-left: 0.5in; margin-right: 0.5in;"><h3 class="title">Note</h3> <p>As can be seen from the previous examples the angle labels have a degree mark "°" by default if the font used is a TTF font (the degree symbol is not available for bitmap fonts) after each label. It is possible to select if this degree mark should be displayed or not with a call to the method <code class="code">PolarAxis::SetAngleDegreeMark()</code>.</p> </div><p> </p> <p> </p><div class="note" title="Note" style="margin-left: 0.5in; margin-right: 0.5in;"><h3 class="title">Note</h3> <p>For the radius labels all standard formatting that can be done to the x-y axis such as format string or format callbacks are supported.</p> </div><p> </p> <p> </p><div class="note" title="Note" style="margin-left: 0.5in; margin-right: 0.5in;"><h3 class="title">Note</h3> <p>A common modification for polar plots is to disable the display of the last label when using a 360 degree plot since the last label will "collide" with the plot box around the plot area. It is possible to disable the last label with a call to <code class="code">Axis::HideLastTickLabel()</code> As can be see this has been used in some of the examples in this chapter.</p> </div><p> </p> </div> </div><div class="navfooter"><hr><table width="100%" summary="Navigation footer"><tr><td width="40%" align="left"> </td><td width="20%" align="center"><a accesskey="u" href="ch16.html">Up</a></td><td width="40%" align="right"> </td></tr><tr><td width="40%" align="left" valign="top"> </td><td width="20%" align="center"><a accesskey="h" href="index.html">Home</a></td><td width="40%" align="right" valign="top"> </td></tr></table></div></body></html>